Vibration Measurement

Vibration can be considered to be the oscillation or repetitive motion of an object around an equilibrium position. Vibrations usually occur because of the dynamic effects of manufacturing tolerances, clearances, rolling and rubbing contact between machine parts and out-of-balance forces in rotating and reciprocating members.

Vibration can be considered to be the oscillation or repetitive motion of an object around an equilibrium position. The equilibrium position is the position the object will attain when the force acting on it is zero.

Vibrations usually occur because of the dynamic effects of manufacturing tolerances, clearances, rolling and rubbing contact between machine parts, and out-of-balance forces in rotating and reciprocating members. Often, small insignificant vibrations can excite the resonant frequencies of some other structural parts and be amplified into major vibration and noise sources.

Image 1: Vibrations caused by an unbalanced wheel


Sometimes mechanical vibration is needed. For example, we generate vibration intentionally in component feeders, concrete compactors, ultrasonic cleaning baths, rock drills, and pile drivers. Vibration testing machines are used extensively to impart a controlled level of vibration energy to products and sub-assemblies where it is required to examine their physical or functional response and ascertain their resistibility to vibration environments.

Image 2: Vibrations caused by a drilling machine


The vibrating body describes an oscillating motion about a reference position. The number of times a complete motion cycle takes place during the period of one second is called the frequency and is measured in hertz (Hz).

The motion can consist of a single component occurring at a single frequency, as with a tuning fork, or of several components occurring at different frequencies simultaneously, as for example, with the piston motion of an internal combustion engine.

On the image below we can see the motion of a tuning fork. A tuning fork is an acoustic resonator in the form of a two-pronged fork. It resonates at a specific constant pitch when set vibrating by striking it against a surface or with an object and emits a pure musical tone.

Image 3: Vibrating tuning forks


The signal from tuning the fork in the Dewesoft recorder and on the FFT widget.

Image 4: Signal from tuning fork in time and in the frequency domain


In the image below we can see the motion of the piston, which can be found in internal combustion engines.

Image 5: Motion of a piston in internal combustion engines


The signal from piston motion in Dewesoft recorder and on FFT widget.

Image 6: Vibration from piston motion in time and in the frequency domain


Vibration signals in practice usually consist of many frequencies occurring simultaneously so that we cannot immediately see just by looking at the amplitude-time pattern, how many components there are, and at what frequencies they occur.

These components can be revealed by plotting vibration amplitude against frequency. The breaking down of vibration signals into individual frequency components is called frequency analysis, a technique which may be considered the cornerstone of diagnostic vibration measurements.

The graph showing the vibration level as a function of frequency is called a frequency spectrogram. When frequency analyzing machine vibrations we normally find a number of prominent periodic frequency components that are directly related to the fundamental movements of various parts of the machine. With frequency analysis, we are, therefore, able to track down the source of undesirable vibration.

Most of us are familiar with vibration; a vibrating object moves - oscillates.

There are various ways we can tell that something is vibrating. We can touch a vibrating object and feel the vibration. We may also see the Emovement of a vibrating object. Sometimes the vibration creates sounds that we can hear or heat that we can sense.

Machine vibration is simply the back and forth movement of machines or machine components. Any component, that moves back and forth or oscillates, is vibrating.

Machine vibration can take various forms. A machine component may vibrate over large or small distances, quickly or slowly, and with or without perceptible sound or heat. Machine vibration can often be intentionally designed and so have a functional purpose. At other times, machine vibration can be unintended and leads to machine damage.

Here are some examples of undesirable machine vibration.

Image 7: Examples of undesirable machine vibration


What causes machine vibration?

Almost all machine vibration is due to one or more of these causes:

  • repeating forces - Most machine vibration is due to repeating forces similar to those causing the boat to rock. Repeating forces such as these act on machine components and cause the machine to vibrate.
  • looseness - Looseness of machine parts causes a machine to vibrate. If parts become loose, vibration, which is normally of tolerable levels, may become unrestrained and excessive.
  • resonance - Machines have their natural oscillation rates.

Vibration amplitude is the characteristic that describes the severity of the vibration and can be quantified in several ways. On the diagram, the relationship between the peak-to-peak level, peak level, the average level, and RMS level of a sine wave is shown.

Image 8: Diagram that shows the relation between parameters that describe vibrations


The peak-to-peak value indicates the maximum excursion of the wave, a useful quantity where, for example, the vibratory displacement of a machine part is critical for maximum stress or mechanical clearance considerations.

The peak value is particularly valuable for indicating the level of short duration shocks etc. But, as can be seen from the drawing, peak values only indicate what maximum level has occurred and the time history of the wave is not taken into account.

The rectified average value, on the other hand, does take the time history of the wave into account but is considered of limited practical interest because it has no direct relationship with any useful physical quantity.

The RMS value is the most relevant measure of amplitude because it takes both, the time history of the wave into account and gives an amplitude value which is directly related to the energy content, and therefore the destructive abilities of the vibration.

When we looked at the vibrating tuning fork we considered the amplitude of the wave as the physical displacement of the fork ends to either side of the rest position. In addition to displacement, we can also describe the movement of the fork leg in terms of its velocity and its acceleration. The form and period of the vibration remain the same whether it is the displacement, velocity, or acceleration that is being considered. The main difference is that there is a phase difference between the amplitude- time curves of the three parameters as shown in the drawing.

Image 9: Displacement, velocity, and the acceleration signal


Velocity is in the 90° phase with displacement, and acceleration is in the 180° phase with displacement.

For sinusoidal signals, displacement, velocity, and acceleration amplitudes are related mathematically by a function of frequency and time, this is shown graphically in the diagram. If the phase is neglected, as is always the case when making time-average measurements, then the velocity level can be obtained by dividing the acceleration signal by a factor proportional to frequency, and the displacement can be obtained by dividing the acceleration signal by a factor proportional to the square of the frequency.

By detecting vibratory acceleration, we are not tied to one parameter alone. With electronic integrators, we can convert the acceleration signal to velocity and displacement. The vibration parameters are almost universally measured in metric units in accordance with ISO requirements. The gravitational constant "g" is still widely used for acceleration levels although it is outside the ISO system of coherent units.

Where a single, wide frequency band vibration measurement is made, the choice of parameters is important if the signal has components at many frequencies. Measurement of displacement will give the low-frequency components most weight and conversely acceleration measurements will weight the level towards the high-frequency components.

Experience has shown that the overall RMS value of vibration velocity measured over the range 10 to 1000 Hz gives the best indication of a vibration's severity. A probable explanation is that a given velocity level corresponds to a given energy level so that vibration at low and high frequencies are equally weighted from a vibration energy point of view. In practice, many machines have a reasonably flat velocity spectrum.

This leads us to a practical consideration that can influence the choice of parameters. It is advantageous to select the parameters which gives the flattest frequency spectrum in order to fully utilize the dynamic range (the difference between the smallest and largest values that can be measured) of the instrumentation. For this reason, the velocity or acceleration parameters are normally selected for frequency analysis purposes.

Because acceleration measurements are weighted towards high-frequency vibration components, these parameters tend to be used where the frequency range of interest covers high frequencies. The nature of mechanical systems is such that appreciable displacements only occur at low frequencies, therefore, displacement measurements are of limited value in the general study of mechanical vibration. Where small clearances between machine elements are being considered, vibratory displacement is, of course, an important consideration.

Displacement is often used as an indicator of unbalance in rotating machine parts because relatively large displacements usually occur at the shaft rotational frequency, which is also the frequency of the greatest interest for balancing purposes.

Acceleration is the rate at which the velocity of an object changes relative to time (it is the derivative of the velocity vector as a function of time a = dv/dt). It is the net result of any and all forces acting upon an object.

In general, we have two basic measurement tasks for acceleration:

  • acceleration as a result of the vibration of the object under test
  • acceleration as a result of a change of velocity of the object, like a vehicle (car, airplane)

There is a big difference in performing these two measurement tasks. The most important information, when measuring vibration acceleration, is the dynamic part of the signal (the object does not move). When measuring the cornering or acceleration/braking of the vehicle, the most important result is the static part of the signal which results in the change of speed.

Therefore the sensors for measuring the change of vehicle movement must have a possibility to measure static acceleration (like gravity) while the sensors for measuring vibrations usually have the static part removed from the results already by the sensor design.

It is also important to know as the speed is a derivation of displacement (v = ds/dt), we can also measure acceleration by measurement of velocity and deriving the signal or by measuring the displacement and double derivation. This is a practical case when measuring surface displacement by using laser or eddy current probes.

It is also very common to also use acceleration measurement to measure velocity and displacement.

The principles of integration are different. When integrating the movement of a vehicle, the static acceleration will result in the change of velocity (and displacement). We need to know that as the acceleration measurement has errors, the result will be a drift in speed and distance. These drifts are determined by the quality of acceleration sensors. With very good sensors the submarines can, for example, run for weeks and still calculate their correct location, but in the »normal world« we are not that lucky since the dynamic part of the signal is much higher and rates of changes are also higher.

Usually, we use a different sensor to compensate for the error. One of the sensor combinations used very frequently is accelerometers/rate of turn/GPS sensors.

When measuring vibrations, the static part is not important and must, therefore, be removed when integrating by high pass frequency filters.

Types of measurement

Acceleration measurements are divided into the following categories:

  • Vibration - an object is said to vibrate when it executes an oscillatory motion about a position of equilibrium. Vibration is found in the transportation and aerospace environments or as simulated by a shaker system.
  • Shock - a sudden transient excitation of a structure that generally excites the structure's resonances.
  • Motion - motion is a slow-moving event such as the movement of a robotic arm or an automotive suspension measurement.
  • Seismic - This is more of a motion or a low-frequency vibration. This measurement usually requires a specialized low noise high-resolution accelerometer.


Accelerometer

Accelerometers are devices that produce electrical signals (voltage, charge, ...) in proportion to the experienced acceleration. There are several techniques for converting acceleration into an electrical signal. We will give a general overview of most of then and then look briefly at a few others.


Image 10: Acceleration sensor


Most accelerometers are based on Hooke's and Newton's first and second laws.

Hooke's law states that the force F needed to extend or compress a spring is proportional to the change of distance x by a factor of k (a constant factor characteristic of the spring). The equation is F = k*x.

Newton's first law states that an object remains at rest or continuous to move at a constant velocity unless acted upon by another force. His second law states that the force F created by a moving object is equal to its mass m times acceleration a, giving the equation F = m*a.

The most general way, to take advantage of these laws, is to suspend a mass on a spring from a frame that surrounds the mass (like in the image below). When the frame is shaken, it begins to move, pulling the mass along with it. If the mass is to undergo the same acceleration as the frame, there needs to be a force exerted on the mass, which will lead to an elongation of the spring. We can use any of a number of displacement transducers (such as a capacitive transducer) to measure this deflection.

The general accelerometer consists of a mass, a spring or a similar system, and a displacement transducer:


Image 11: Scheme of an accelerometer that consists of a mass, a spring, and a displacement transducer


Two configurations of piezoelectric accelerometers are in common use:

  • The compression type where the mass exerts a compressive force on the piezoelectric element 
    Image 12: Compression type of a piezoelectric accelerometer


  • The shear-type where the mass exerts a shear force on the piezoelectric element. 
    Image 13: Shear type of a piezoelectric accelerometer


Accelerometers are designed by using various sensing principles. Here is a quick overview and summary to give you a better understanding of them:

  • Piezoelectric - Works based on the ability of the piezoelectric materials to change its electric potential when under stress. They offer unique advantages, compared to other accelerometers. They have a wide dynamic range, excellent linearity, wide frequency range (from a few Hz to 30 kHz), are the one only accelerometers capable of measuring alternating acceleration, but are incapable of measuring DC responses. Because they have no moving parts durability is increased. And unlike other sensors, they do not require an external power source.
  • Piezoresistive - Works similarly to piezoelectric materials, with the difference being that it changes the electrical resistance of the material, and not the electrical potential. These sensors are capable of measurements of up to ±1000 G, have a true DC response, and a typically used in micro-machined structures.
  • Capacitive - A metal beam or some other micromachined feature produces capacitance, which is changed when the sensor is accelerated. They are most commonly used in MEMS ( Micro-Electro-Mechanical System) accelerometers and have similar characteristics as potentiometric sensors in terms of frequency, dynamic range, and DC response.
  • Potentiometric - The wiper arm of the potentiometer is attached to the spring-mass, which results in a change or resistance when the spring moves. The natural frequency of these devices is generally less than 30 Hz, limiting them to low-frequency vibration measurements. They also have a limited dynamic range, but they can measure down to 0 Hz ( DC response)
  • Hall effect - A magnet is attached to a spring, and when force is applied, it will move causing a change in the electric field of the hall element.
  • Magnetoresistive - Works similarly as the hall effect sensor, with the difference being that a magnetic resistance element is used instead of the hall element.
  • Fiber Bragg grating - Any change in the grating pitch of optical fiber results in the change of Braggs wavelength, from which we can calculate the acceleration.
  • Heat transfer - A single heat source is centered in a substrate. Thermoresistors are equally placed apart on all four sides of the heat source. When the sensor is accelerated the heat gradient will be asymmetrical because of convection heat transfer.

Most manufacturers have a wide range of accelerometers and at first sight, it may be an overwhelming choice. A small group of "general purpose" types will satisfy most needs. These are available with either top or side-mounted connectors and have sensitivities in the range of 1 to 100 mV or pC per m/s2.


Dewesoft accelerometers


Image 14: Table of Dewesofts acceleration sensors


Image 15: Table of Dewesofts acceleration sensors


The remaining accelerometers are made for a particular application. For example, small size accelerometers that are intended for high level or high-frequency measurements and for use on delicate structures, panels, etc. and which weigh only 0,5 to 2 grams.


Image 16: Miniature accelerometer with a small mass


Other special-purpose types are optimized for: simultaneous measurement in three mutually perpendicular planes; high temperatures; very low vibration levels; high-level shocks; calibration of other accelerometers by comparison; and for permanent monitoring of industrial machines.


Image 17: Special-purpose type of acceleration sensor


Piezoelectricity is the ability of some materials (notably crystals and certain ceramics - known piezoelectric materials are quartz, tourmaline, ceramic (PTZ), GAPO4, ...) to generate an electrical potential in response to applied mechanical stress. This may take the form of a separation of electric charge across the crystal lattice. If the material is not short-circuited, the applied charge induces a voltage across the material. Materials that produce an electric charge when a force is applied to them exhibit what is known as the piezoelectric effect.

Piezoelectric acceleration sensors work on the principle that a piezoelectric material (usually an artificially polarized ferroelectric ceramic) is built between the bottom of the sensor housing and the seismic mass. When the sensor is moved, this mass compresses the piezoelectric material which produces a very small voltage output. Collected on the electrode, the high impedance electrical charge signal can be conditioned by either internal or external electronics for measurement purposes. Accelerometers containing internal electronics are classified as Integrated Electronic Piezoelectric (IEPE), but commonly referred to by users as voltage mode accelerometers. Piezoelectric accelerometers require external charge amplifiers for signal conditioning called charge mode accelerometers. Voltage mode piezoelectric accelerometers incorporate built-in, signal conditioning micro-electronics. IEPE has been adopted as the standard by the industry's sensor, analyzer, and data acquisition manufacturers.

Piezoelectric sensors are commonly used in modal analysis, environmental stress screening, pyrotechnic events, aircraft ground vibration tests, aircraft flight tests, and predictive and preventive maintenance.

Voltage mode accelerometers - IEPE

All of these voltage mode accelerometers are powered by a regulated DC voltage and 2 to 20 mA of constant current sensor excitation over a simple two-wire scheme. The built-in electronics convert the high impedance charge signal generated by the piezoelectric material into a useable low impedance voltage signal right inside the transducer. Since the output is low impedance, the signal can be transmitted over long cable distances and used in the dirty field or noisy factory environments with little degradation. IEPE sensors need a power supply of 4 mA or 8 mA and they typically give out a 5-volt signal, thus it is much easier to transfer these signals over longer cables. Also, the amplifiers for these sensors are much easier to build, and are, therefore, cheaper than normal piezoelectric sensors. The amplitude measurement range is quite limited. We could hardly find a sensor which measures more than 100g. There are single axis as well as triaxial sensors. Lately, really nice sizes have become available - one can find a triaxial sensor as a cube measuring as little as 10 mm, and with the weight as light as 5 grams.

We can use the Dewesoft Sirius or DEWE-43 to measure with these sensors. Sirius ACC can directly connect IEPE sensors while STG, STG-M, or DEWE-43 needs DSI-ACC adapter to measure with these sensors.


Image 18: Dewesofts IEPE acceleration sensor


Charge mode accelerometers


Charge mode piezoelectric accelerometers output the high impedance electrical charge signal generated directly from the piezoelectric sensing element. These transducers require an external charge amplifier (better option) or an in-line charge converter to convert the high impedance charge signal to a low impedance voltage signal suitable for measurement purposes. Since the output is high impedance, the charge signal is very sensitive to noise from the surrounding environment and several important precautionary measures should be taken for proper measurements. Special low noise coaxial cables should be used between the transducer and the external charge amplifier. These cables are specially treated (for example, lubricated with graphite) to reduce triboelectric, or motion-induced, noise effects. Also, it is critical to maintaining high insulation resistance of the transducer, cabling, and connectors by keeping them dry and very clean. Given these precautions compared with the simple operation of voltage-mode accelerometers, charge mode accelerometers are generally only used in high temperature, high acceleration applications, or if the customers have hundreds of them on the stock from times that IEPE sensors were not yet available. Additionally, the piezoelectric accelerometer is self-generating so that it doesn't need a power supply. There are no moving parts to wear out, and finally, its acceleration proportional output can be integrated to give velocity and displacement proportional signals.

We can use Sirius CHG directly as it supports charge input and MULTI, STG or DEWE-43 with MSI-BR-CH, but please make sure that the dynamic range is sufficient for your application.


Image 19: Scheme of a charge mode accelerometer


The last important characteristic of all piezoelectric transducers (voltage mode and charge mode alike) is their AC behavior. The piezoelectric material is unable to hold its charge output due to a static input. In other words, it only senses dynamic events and thus cannot be used to measure DC acceleration. The design of the charge amplifier electronics (whether integrated internal or external) define the low-frequency AC couple of the measurement signal. Typical low-frequency performance of piezoelectric accelerometers ranges from ½ to several Hz.

A comparison between IEPE and Charge mode accelerometers


IEPE SensorsCharge mode sensors
Advantages
  • fixed sensitivity regardless of cable length and cable quality
  • low-impedance output can be transmitted over long cables in harsh environments
  • inexpensive signal conditioners and cables
  • intrinsic self-test function
  • withstands better harsh conditions like dirt and humidity
  • no power supply required - ideal for battery-powered equipment
  • no noise, highest resolution
  • wide dynamic range
  • higher operating temperatures
  • smaller sensors possible
Disadvantages
  • constant current excitation required (reduces battery operating hours)
  • inherent noise source
  • upper operating temperature limited to < 120°C
  • limited cable length (< 10 m)
  • special low noise cable required
  • charge amplifier required


Both, charge and IEPE sensor types have a common limitation: they can't measure a static acceleration. They usually start to measure from 0.3 Hz to 10 Hz, depending on the sensor. For static or very low-frequency measurements, the user needs to use a different kind of sensor. A very popular type is the Micro-Electro-Mechanical System sensor (or MEMS). This is actually a microchip that has a mechanical structure (a cantilever beam or seismic mass) that changes its electrical property (usually capacitance) related to the acceleration. Capacitive interfaces have several attractive features. In most micromachining technologies, no or minimal additional processing is needed. Capacitors can operate both as sensors and actuators. They have excellent sensitivity and the transduction mechanism is insensitive to temperature. Capacitive sensing is independent of the base material and relies on the variation of capacitance when the geometry of a capacitor is changing.

Typical MEMS accelerometer is composed of movable proof mass with plates that is attached to a mechanical suspension system to a reference frame, as shown in the picture below:


Image 20: Scheme of a typical MEMS sensor assembled of a movable proof mass with plates that is attached to a suspension system 


MEMS sensors were very special since they were used to measure earthquakes or any other slow movements. But with the development of airbag technology, there was a big need to make a low-cost sensor that measures the static acceleration. Therefore, the single-chip solution emerged for this purpose. Lately these sensors are used also in low-cost gyro systems and we can find sensors which also have quite good bandwidth up to several kHz and quite low noise level (though still bigger than IEPE sensors with the same measurement range). They became indispensable in the automobile industry, computer and audio-video technology.

Image 21: An example of MEMS accelerometer


When choosing any kind of sensor, it is important to answer the following questions:

  • What are we measuring and under which conditions?
  • What are the relevant factors concerning our measurements?
  • What do we wish to gain from our measurements in terms of quality, quantity, and price?

What follows is a short summary of the characteristics.

Ground isolation

Accelerometers with ground isolation usually have an isolated mounting base and an isolated mounting screw, or in some cases, the entire accelerometer case is the ground isolated.

Ground isolation becomes important when the test articles surface is conductive and at ground potential. A difference in ground voltage levels between the electronic instrumentation and the accelerometer may cause the ground loop resulting in erroneous data.

Sensitivity

The sensitivity is the first characteristic normally considered. Ideally, we would like a high output level, but here we have to compromise because high sensitivity normally requires a relatively big piezoelectric assembly and consequently a relatively large, heavy unit. In normal circumstances, the sensitivity is not a critical problem as modern preamplifiers are designed to accept these low-level signals.

Low-frequency range

The requirement for vibration measurements is usually that the sensor has a lower high pass cutoff than the frequencies of interest of the devices currently being tested. On a rotating machine normally running with 50 Hz, we can choose a sensor with a 5 Hz cut off. When measuring building or ship vibration, this level must be very low. Another important thing, to consider, is bandwidth since the lower it gets, the longer is recovery times from shocks or overloads. Also, the amplifier should follow the bandwidth of the sensor. It is nice if the amplifier has at least two ranges in order to be more flexible in measurements. A typical application for low-frequency measurements is the paper mill rolls. They have a frequency of 1-5 Hz, where the user would need a sensor with 0.3 Hz or less bandwidth. For those applications, charge or IEPE are most suitable. If we need to measure the static acceleration then a different sensor technology, like MEMS sensors, is needed.

The low-frequency range, over which the accelerometer gives a true output, is limited at the low-frequency end in practice, by two factors. The first is the low-frequency cut-off of the amplifier which follows it. This is normally not a problem as the limit is usually well below one Hz. The second is the effect of the ambient temperature fluctuations, to which the accelerometer is sensitive. With modern shear-type accelerometers, this effect is minimal, allowing measurements below 1 Hz for normal environments. 

Bandwidth (frequency range) 

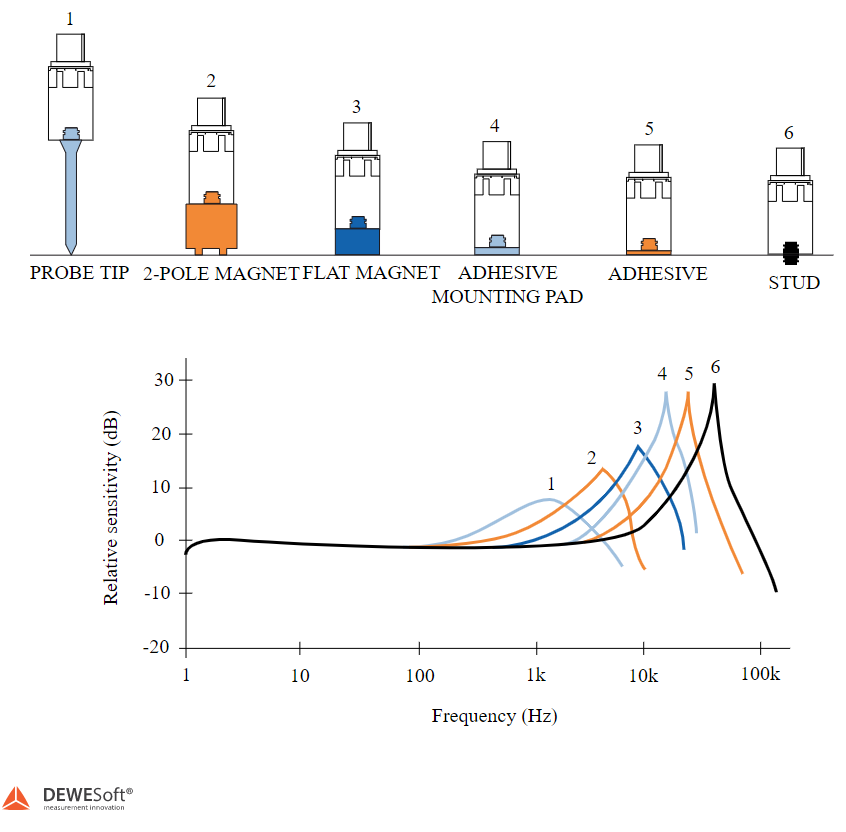
Mechanical systems tend to have much of their vibration energy contained in the relatively narrow frequency range between 10 Hz to 1000 Hz but measurements are often made up to say 10 kHz because interesting vibration components are often present at these higher frequencies. Therefore, we must ensure, when selecting an accelerometer, that the frequency range covers the range of interest. The upper limit is determined by the resonant frequency of the mass-spring system of the accelerometer itself. As a rule of thumb, if we set the upper-frequency limit to one-third of the accelerometer's resonance frequency, we know that the vibration component measured at the upper-frequency limit will be in error by no more than + 12%.

With small accelerometers where the mass is small, the resonant frequency can be as high as 180kHz, but for the somewhat larger, higher output, general-purpose accelerometers, resonant frequencies of 20 to 30kHz are typical. 

We need to be careful about the increased sensitivity at sensor high-frequency end due to its resonance. Reading in this area will be too high but can be removed in the frequency domain if sensor transfer characteristics are known (by using transfer curves in Dewesoft).

Amplitude range

Charge sensors have the biggest amplitude ranges (specially designed shock sensors can have more than 100 000 g amplitude range), but IEPE is also fairly high (up to 1000 g). MEMS sensors usually have a very limited range (up to a few hundred g). For general purposes, it is best to use IEPE, whereas for high levels piezoelectric sensors are better. Sometimes (for example for seismic applications) an accelerometer with high sensitivity is required (2 g or lower range).

Maximum shock level

The charge sensors are the least sensitive to shock. They can sustain up to 100 000 g of shock while IEPE can usually take not more than 5 000 to 10 000 g. MEMS sensors are even more sensitive to shock.

Noise level

The residual noise level defines the lowest amplitude level of what the sensor will measure. This is also the reason why we should take a sensor with the optimum measurement range because sensors with a higher range will also have a higher noise level.

IEPE sensors have a very high dynamic range (we can see signals better than 160 dB below the maximum range). Charge sensors are similar, but we need to consider that the noise can be easily generated in the cable. MEMS sensor is much worse in a dynamic range limited by internal electronics.

Temperature range

All the sensors, that include electronics, have a limited high-temperature range, up to 130 deg C. The temperature range of charge sensors is much higher - even up to 500 deg C. Please note however that this also requires a high-temperature cable.

All piezoelectric materials are temperature dependent so that any change in the ambient temperature will result in a change in the sensitivity of the accelerometer. Piezoelectric accelerometers also exhibit a varying output when subjected to small temperature fluctuations, called temperature transients, in the measuring environment. This is normally only a problem when very low level or low-frequency vibrations are being measured. Modern shear-type accelerometers have a very low sensitivity to temperature transients. When accelerometers are to be fixed to surfaces at higher temperatures than 250°C, a heat sink and mica washer can be inserted between the base and the measuring surface. With surface temperatures of 350 to 400°C, the accelerometer base can be held below 250°C by this method. A stream of cooling the air can provide additional assistance.

MEMS sensor temperature range is limited by internal electronics (from -40°C to 125°C).

Weight

In some applications, like modal testing, weight can be a big factor due to the mass loading effect. The added mass to the structure changes the dynamic behavior, so ideally a sensor should have no mass at all. 

That is kind of hard to achieve by normal design, but we can use laser contactless sensors in such cases. As a general rule, the accelerometer mass should be no more than one-tenth of the dynamic mass of the vibrating part onto which it is mounted.

Ground loops

The ground loop currents can flow in the shield of accelerometer cables because the accelerometer and measuring equipment is earthed separately. The ground loop is broken by using an isolated sensor, an isolated amplifier or electrically isolating the accelerometer base from the mounting surface by means of an isolating stud.

Cable noise

Cable noise is mainly the issue of piezoelectric accelerometers having a high output impedance. These disturbances can result from triboelectric noise or electromagnetic noise. 

Triboelectric noise is often induced into the accelerometer cable by the mechanical motion of the cable itself. It originates from local capacity and charge changes due to dynamic bending, compression, and tension of the layers making up the cable. This problem is avoided by using a proper graphitized accelerometer cable and taping or gluing it down as close to the accelerometer as possible.

Electromagnetic noise is often induced in the accelerometer cable when it is placed in the vicinity of running machinery.

Transverse vibrations

Piezoelectric accelerometers are sensitive to vibrations acting in directions other than coinciding with their main axis. In the transverse plane, perpendicular to the main axis, the sensitivity is less than 3 to 4% of the main axis sensitivity (typically < 1%). As the transverse resonant frequency normally lies at about 1/3 of the main axis resonant frequency this should be considered where high levels of transverse vibration are present.
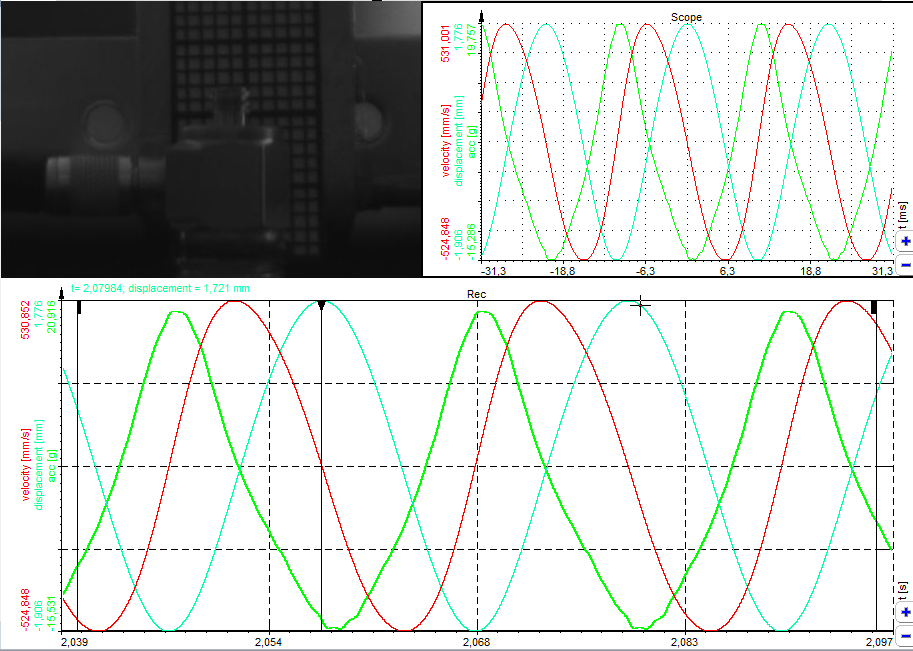

The sensors can be mounted in different ways. The bandwidth of the sensor is especially sensitive to the way it is mounted. The method of mounting the accelerometer to the measuring point is one of the most critical factors in obtaining accurate results from practical vibration measurements. Sloppy mounting results in a reduction in the mounted resonant frequency, which can severely limit the useful frequency range of the accelerometer.

  • Stud - it is best to drill a hole in the test specimen and fix the sensor to the surface with a screw. This should not affect any sensor property. Obviously, in some cases, a customer might not be particularly thrilled to do this, for example, to his brand new prototype of an airplane wing.
  • Adhesive - another type of mounting, which doesn't affect the bandwidth that much is a thin double-sided adhesive tape or beeswax (this is limited in its temperature range).
  • Magnet - a very widely used mounting technique for machine diagnostics is to mount the sensor on a magnet. This will still produce a good bandwidth, but of course, the surface must be ferromagnetic (not aluminum or plastic). On sensors where we can use the mounting clip, we can glue the mounting clip upfront and then just attach the sensor itself.
  • A "quick and dirty" solution is also to hold down the sensor with a hand on a rod. This is useful for some places which are hard to reach, but the bandwidth will be cut to 1-2 kHz.

The accelerometer should be mounted so that the desired measuring direction coincides with its main sensitivity axis. Accelerometers are also slightly sensitive to vibrations in the transverse direction, but this can normally be ignored as the transverse sensitivity is typically less than 1% of the main axis sensitivity.

A graph below is showing the bandwidth reduction from different mounting methods:


Image 22: A graph showing bandwidth reduction from different mounting methods


Eddy-current sensors are non-contact devices capable of high-resolution measurement of the position and/or change of position of any conductive target. Eddy-current sensors are also called inductive sensors, but generally "eddy current" refers to precision displacement instruments and "inductive" refers to inexpensive proximity switches. High resolution and tolerance of dirty environments make eddy-current sensors indispensable in today's modern industrial operations.

Eddy-current sensors operate with magnetic fields. The driver creates an alternating current in the sensing coil at the end of the probe. This creates an alternating magnetic field with induces small currents in the target material - these currents are called eddy currents. The eddy currents create an opposing magnetic field which resists the field being generated by the probe coil. The interaction of the magnetic fields is dependent on the distance between the probe and the target. As the distance changes, the electronics sense the change in the field interaction and produce a voltage output which is proportional to the change in distance between the probe and target. The target surface must be at least three times larger than the probe diameter for normal, calibrated operation.

Eddy-current sensors are used to detect surface and near-surface flaws in conductive materials, such as metals. Eddy current inspection is also used to sort materials based on electrical conductivity and magnetic permeability and measures the thickness of thin sheets of metal and nonconductive coatings such as paint.

Image 23: Scheme of an Eddy-current sensor


AdvantagesDisadvantages
Detects surface and near-surface defects.Only conductive materials can be inspected.
Test probe does not need to contact the partFerromagnetic materials require special treatment to address magnetic permeability.
The method can be used for more than flaw detection.The depth of penetration is limited.
Minimum part preparation is requiredFlaws, that lie parallel to the inspection probe coil winding direction, can go undetected
Tolerance of dirty environmentsSkill and training required are more extensive than other techniques.
Not sensitive to material in the gap between the probe and targetSurface finish and roughness may interfere.
Less expensive and much smaller than laser interferometers
Reference standards are needed for setup

Position measurement

Image 24: Position measurement with Eddy-current sensors


Eddy-current sensors are basically position measuring devices. Their outputs always indicate the size of the gap between the sensor's probe and the target. When the probe is stationary, any changes in the output are directly interpreted as changes in the position of the target. This is useful in:

  • automation requiring precise location
  • machine tool monitoring
  • final assembly of precision equipment such as disk drives
  • precision stage positioning

Vibration measurement

Image 25: Vibration measurement with Eddy-current sensors


Measuring the dynamics of a continuously moving target, such as a vibrating element, requires some form of non-contact measurement. Eddy-Current sensors are useful whether the environment is clean or dirty and the motions are relatively small. Eddy-current sensors also have a high-frequency response (up to 80 kHz) to accommodate high-speed motion. They can be used for:

  • drive shaft monitoring
  • vibration measurements

Required hardwareSirius ACC or MULTI, STG, DEWE-43 with MSI-BR-ACC or MSI-BR-CH
Required softwarePROF or DSA version
Setup sample rateAt least 5kHz

Let's do some vibration measurements in Dewesoft. Since the vibration is difficult to visualize and since there were lots of questions about the difference between acceleration, vibration velocity, and displacement, it is helpful to actually show the vibration.

This example has a shaker with an attached light plastic structure that has a low natural frequency. At the same time, a video of the movement of this beam was taken with a high-speed camera. This helps to really see the vibrations as they were measured with the accelerometer.


Image 26: Demo equipment for vibration measurement


It is always advisable to use a measurement device with an anti-aliasing filter. Otherwise, we can never be sure that the measurement is correct. Quite often acceleration in a high-frequency range (around 20 kHz) is very high. If a device without anti-aliasing filters is used, and samples with lower sampler rates are taken, those high frequencies will be mirrored in the lower range. Especially for measurements like modal analysis, this is the most important criterion.


There are three ways to perform the setup of the sensor:

  • user can enter it from the calibration sheet,
  • user can calibrate it with the calibrator,
  • user can use TEDS technology to read out calibration values.
  1. Entering the setup from the calibration sheet. It is helpful to take a look at the sensor calibration sheet. There are the sensitivity of the sensor, expressed either in mV/(m/s2) or mV/g (or both) for IEPE sensors and in pC/g for piezoelectric (charge) sensors. The picture below shows the calibration datasheet for a triaxial sensor. The Reference sensitivity is the key value to be entered in the Dewesoft setup. 
    Image 27: Calibration certificate for accelerometer


    First, as usual, we should enter the Units of measurement. In this case, we use m/s2. Then it is best to go to the Scaling by function section. We check the Sensitivity box and enter 9.863 mV/(m/s2) in the sensitivity field. Also do not forget to set IEPE measurements. 


Image 28: Setting up an accelerometer


  1. The second way is to do the calibration. We can use a standard old accelerometer calibrator which outputs 10 m/s2 peak level acceleration (7,07 m/s2 RMS). The sensor is attached to the calibrator, and the acceleration level is adjusted to the sensor mass. 

  2. Image 29: Calibrator for accelerometers


    Then we enter in Scaling by two points the acceleration level of 7,07 m/s2 and click calibrate "from RMS". The current measured voltage level in mV is written to the second point scaling. 


Image 30: Calibration from AC RMS Scaling by two points


  1. There we can already see if the calibration was successful or not. In the data preview, we can see that the peak level is approximately 10 m/s2 and the RMS is around 7,07. We can also select the Scaling by function and compare measured sensitivity to the calibration datasheet. 


Image 31: Sensitivity of the accelerometer


  1. The third, quite a new way of sensor setup, is the use of an electronic calibration sheet - TEDS. With a TEDS sensor, it is quite easy to select settings. Plug the sensors into the Sirius ACC, run Dewesoft X and the sensors should be recognized immediately. TEDS works only if the amplifier is in the IEPE mode (it doesn't work in the voltage mode). If this is set up later (after the first scan) or if we plug in the sensor when Dewesoft X is already running on the setup screen, the TEDS sensors need to be rescanned. This can be done by clicking on the AMPLIFIER column caption on the basic setup screen and selecting the Rescan modules option. TEDS will also work with MSI-BR-ACC. When a sensor is correctly recognized, scaling factors, sensor serial number, and Recalibration date will be read from the sensor. In the setup screen, the user doesn't have to enter the sensitivity since it is already filled in from the sensor. This principle is easy and straightforward, and it prevents user errors. 


Image 32: Calibration with TEDS


Image 33: Information written on TEDS


The second step is to calculate the vibration velocity and displacement. This can be achieved directly in the channel setup with the filter since the integrator is actually nothing more than a filter.

Image 34: Displacement and Velocity calculation in Channel setup


We enter integration and double integration in the setup - first will be the integrator (for calculation of vibration velocity) and the second one will be the double integrator (for measurement of the displacement).

We should choose Integration as a math operation. Since the DC offset is merely an error in measurement and calculation, we need to set up the high pass filter (in Flow field) to cut off the DC offset. For single integration, the Order of the filter needs to be at least two(if filter order is one, there will be static offset left in the result, if there is no filter, it will drift away).

Next, we select the units. If the integration is from acceleration to velocity and the acceleration unit is m/s2, the output unit is normally m/s. If the scale is 1, the units are in m/s. If we choose the scaling factor 1000, we will have units in mm/s.

Image 35: Velocity filter


It is also interesting to know the vibration displacement. For this, we should set up another channel by again selecting Acceleration and selecting double integration. Since the double integrator is in fact a second-order filter, we need to set the high pass filter to the Order at least three or higher. Usually, the displacement caused by the vibration is not visible by the eye and is measured in micrometers, but since this measurement has quite high values, the output unit was set to be in mm. The scaling factor is therefore again 1000. We can already see in the preview that the peak-peak movement is around 15 mm and since this is a value that can be confirmed with the eye, we can be sure that the scaling factors and the settings are correct.

Image 36: Displacement filter


In the analysis model, we can look through the data. Here, one picture is put on top of another to see the movement of the accelerometer. The first picture below is the upper point of displacement.

On the scope of the right, we can see nicely that the acceleration, displacement, and velocity are phases shifted.

On the recorder graph below, we can analyze the acceleration, velocity, and displacement. The displacement (blue curve) is in the upper position. The velocity (red curve) is zero - this is also clear because the upper point is a turnaround and before reaching this point on the top, the velocity is decreased and at the top point, the velocity is zero. The acceleration (green curve) at the top is at maximum in the negative direction. Acceleration is the rate of change of the velocity. We can see from the velocity curve that the rate of change is at a maximum at the top; therefore the acceleration is at its maximum at the top dead point

Image 37: Maximum displacement, minimum velocity


Now let's go to the next significant point of the movement - the center point. We can see that it is the center point because the displacement is in the middle. The velocity of the center is at a maximum in the negative direction. The beam is reaching the middle point with the maximum velocity, and it will slowly start to decelerate. Acceleration at that point is zero - when a body is standing still or moves with constant velocity, its acceleration is zero. This can be confirmed by observing the blue acceleration curve.

Image 38: Maximum velocity, minimum displacement


The third significant point is the bottom point. Here, a top point is shown in the background for reference. Displacement is at the lowest point, velocity is zero and will continue to increase, the acceleration is at a maximum in the positive direction - the speed is changing at a maximum rate at this point.

Image 39: Bottom point, maximum displacement, minimum velocity


We conducted a simple experiment to get a better feeling about the vibration measurement. In practice, the vibration measurement would surely look different, but we would use the same basic principles as shown in this example.


Let's do some vibration measurements in Dewesoft. Since vibration is difficult to visualize and since there were lots of questions about the difference between acceleration, vibration velocity, and displacement, it is helpful to actually show the vibration.

Measurement was made with our shaker. We tested our new product KRYPTON.

Vibration durability test

Video shows the vibration durability test of our latest product - KRYPTON.


On the image below we can see the screenshot from software that runs the shaker. We set the frequency sweep from 10 Hz to 250 Hz, and the maximum acceleration was up to 33 g.

Image 40: Screenshot from the software that runs the shaker


On the shaker near KRYPTON, the Dewesoft accelerometer was fixed with glue. Let's see the signal from the accelerometer.

Image 41: Time-domain signal from an accelerometer attached to a shaker


Let's take a look at the maximum acceleration detected by the Dewesoft accelerometer. As is seen in the picture, the maximum was at 325.9 m/s2, which is 33 g.

Image 42: Maximum detected acceleration


Shock test

The next test was a shock test. The product is exposed to multiple shocks that reach 50 m/s2 in our case but can go up to 100 m/s2.

Image 43: Time-domain signal that shows the shock signal


Drop test

The next measurement was made with a drop test. As you can see in the video below the product is lifted up, and then falls down, because of gravity. When the aluminum plate hits the ground, the object under test can be hit with 900 g.


In our case, KRYPTON was hit with 957.5 m/s2 which is equivalent to almost 100 g.

Image 44: Time-domain signal of a drop test


Envelope detection is a procedure for the early detection of faults on ball bearings.

To add a new envelope detection math module go to a math section and select Envelope detection under Add math section.

Image 45: Adding a new Envelope detection math


Envelope detector has several stages and for each stage, the parameters must be set:

Image 46: Settings in the Envelope detection math


Settings

Calculation type defines the principle of calculation:

  • Filtering - uses a filter procedure for envelope calculation. Filtering is a standard procedure for calculating the envelope used also in other implementations.
  • Peak detection - uses the procedure of detecting peak values in the signal. Peak detection is a procedure that calculates amplitudes more exact than filtering.

Use Bandpass checkbox enables or disables the first stage of calculation - bandpass filtering. The acceleration sensor measures the entire frequency range and acquires unbalance, misalignment, and other faults on the machine. Ball-bearing errors have very low energy and, therefore, is a small contribution to the entire frequency spectrum.

Signal band

At signal band setup, we have to define the lower and upper-frequency limit

Envelope band

At envelope band setup, we have to define the lower and upper-frequency limit

Bearing database - Kinematic cursor editor

In bearing database, we select the type of machinery. If it is not listed you can add your own in the Kinematic cursor editor. The frequency of interest is automatically calculated based on geometry.

Image 47: Kinematic cursor editor


When an error of the ball bearing occurs, it will produce ringing with a frequency that corresponds to its natural frequency. This ringing will repeat each time when a damaged part of the ball hits the ring or vice versa. We have to know that the inner ring, outer ring, cage, and balls have different typical repeating frequencies depending on the geometry of the bearing and the rotational frequency.

To only focus on these high frequencies of the ringing, we have to look at the original frequency spectrum. We have generated a sine wave that has a small 10 kHz rings on top. In the frequency domain, we don't see at all the frequency that the ringing repeats, but only a major sine wave (could come from unbalancing) and very high frequency coming from the bearing.

Image 48: Ringing causes high-frequency component on the original signal


Bandpass filtering in the envelope detector must be set to remove all components except ringing of the ball bearing. This can be usually found around 10 kHz. In our example, I have set a lower frequency limit to 6 kHz and the upper limit to 12 kHz to get all the energy. The signal after filtering would look like this:

Image 49: Bandpass filtering to remove all components except the ringing


Only high frequency remains, but we still don't see the main low frequency with which the rings are repeating. Therefore, we have to apply an envelope to the signal. The envelope will draw a curve around the peaks of the signal, producing only a positive part of the data. To get the correct amplitude, we have to choose the Envelope band frequency. Bearings usually have typical frequencies up to 500 Hz and we also might want to Remove DC component in order to see a nice frequency spectrum without large DC value coming from DC offset. After this filter, the signal looks like one in the picture below and the frequency spectrum of the envelope signal reveals the frequency of hits.

Image 50: Envelope signal that draws around the curve of the peaks


This was a simulated case to see the math procedure behind the calculation. In reality, the signal will look like this.

Image 51: Real-life measurement screen to identify the faults on bearings


Not much to see from the time signal, but with the calculation of typical frequencies, we can see that the outer ring frequency is clearly shown in the FFT of the envelope signal.

The following picture shows the typical damage of the outer ring of the large bearing (courtesy of Kalmer d.o.o. Trbovlje).

Image 52: Damaged outer ring of the large bearing