Rotational and Torsional Vibration Measurement and Analysis

Torsional vibrations are important whenever power needs to be transmitted using a rotating shaft or couplings, such as in the case of automotive, truck and bus drivelines, recreation vehicles, marine drivelines or power-generation turbines. Torsional vibrations are angular vibrations of an object and rotational vibration is simply the dynamic component of the rotational speed.

Vibrations are mechanical oscillations, that occur around an equilibrium point. The oscillations can be periodic or random.

Vibrations of any mechanical device in operation are typically unwanted. Such vibrations can be caused by imbalances in the rotating parts, uneven friction, the meshing of gear teeth,... We can minimize unwanted vibrations with proper designs.

We can decompose any vibrating system into elementary parts:

  • spring - a means of storing potential energy (k)
  • mass - a means of storing kinetic energy (m)
  • damping - a means by which energy is gradually lost (c)

Vibrations can be classified as:

  • free (after the initial disturbance, the system is left to vibrate on its own) and forced (the system is subjected to an external force, often a repeating type of force)
  • damped and undamped
  • linear (all the basic components of a vibration system the spring, the mass, and the damper behave linearly) and nonlinear (one or more basic components of a vibration system are not linear)
  • deterministic (magnitude of the excitation (force or motion) acting on a vibratory system is known at any given time) and random (the value of the excitation at any given time can not be predicted - wind velocity, road roughness and ground motion during an earthquake)

When the system vibrates with its own natural frequency, it falls into resonance - it oscillates with the largest amplitude at the same excitation force.

Quantities that are used to describe the vibrations are:

  • displacement (in [m])
  • velocity (in [m/s])
  • acceleration (in [m/s2])

All three quantities are directly related to each other - velocity is a derivation of displacement and acceleration is a derivation of velocity.

Torsional vibration

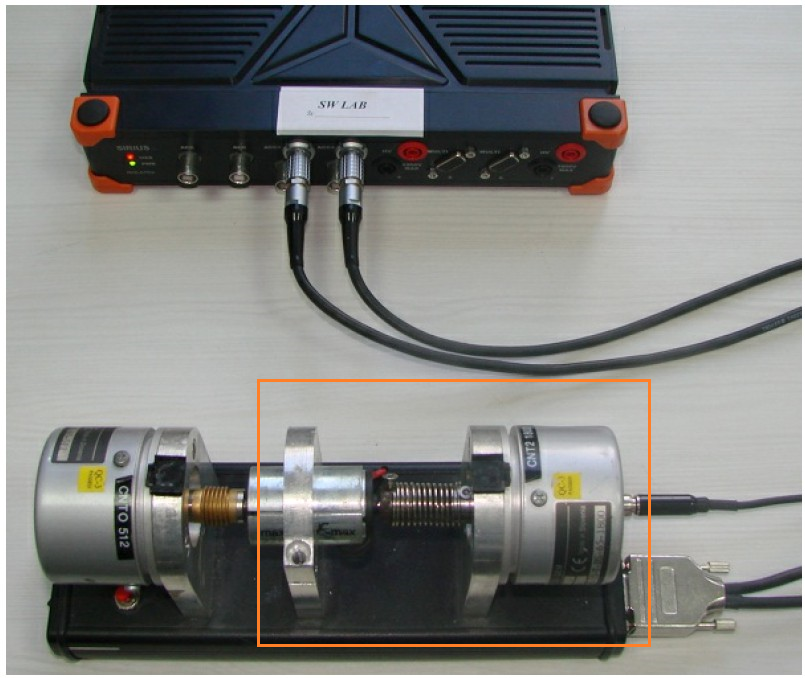
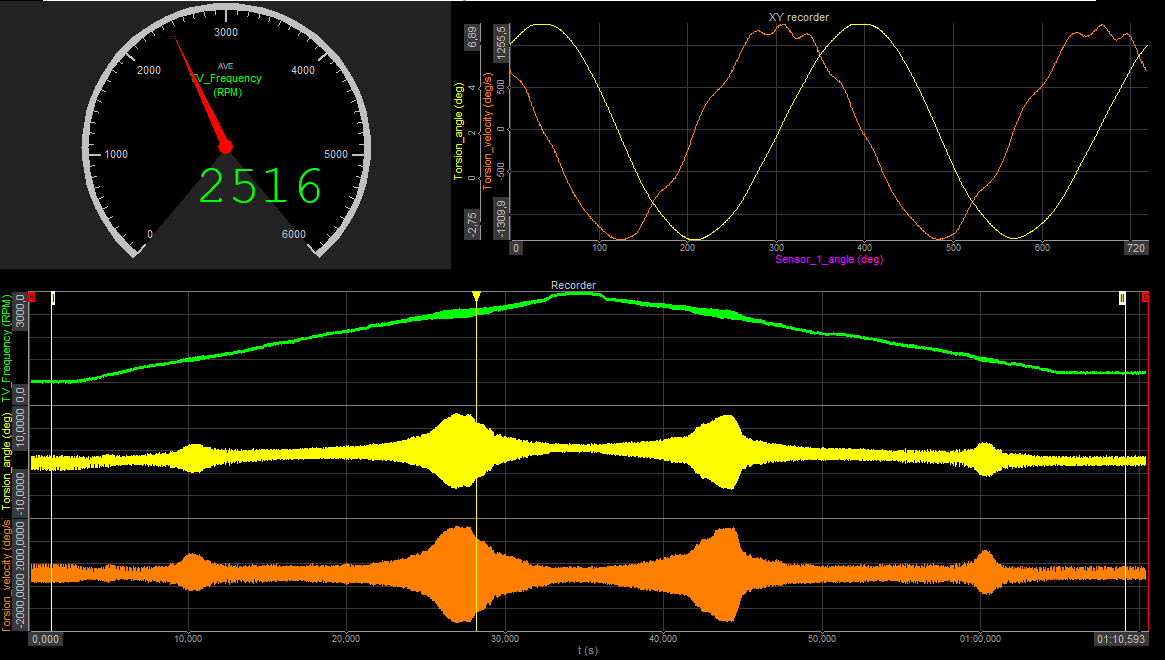
Torsional vibrations are angular vibrations of an object, typically a shaft along its axis of rotation. Torsional vibrations are evaluated as the variation of rotational speed within a rotation cycle. RPM variations are typically induced by a rough driving torque or a varying load.


Image 1: Torsional vibrations


The level of torsional vibration is influenced by a number of parameters, such as material properties, operating conditions (such as temperature, load, RPM, etc.).

Torsional vibrations are important whenever power needs to be transmitted using a rotating shaft or couplings, such as in the case of automotive, truck and bus drivelines, recreation vehicles, marine drivelines or power-generation turbines.

Quantities that are used to describe the torsional vibrations are:

  • angular position (in [rad] or [°])
  • angular velocity (in [rad/s] or [°/s] or [RPM])
  • angular acceleration (in [rad/s2] or [°/s2])

All three quantities are directly linked to each other and can be derived by integration and differentiation. The most common quantity used to measure torsional vibrations is the angular velocity or RPM.

The source of excitation is quantified by torque.

The angular velocity and displacement quantify the response of the applied torque. Torque and angular velocity are linked to each other:

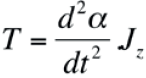
Where T is torque in [Nm] and Jz is the torsion constant or the polar moment of inertia in [m4].

This formulation is similar to the formulation of Newton's law, which links the force acting on a mass to the acceleration of that mass.

The torsional vibration software option of Dewesoft is used to obtain a rotational/torsional vibration monitoring and analyzing solution, for research, development, and optimization. With the small form factor of the Dewesoft instruments (e.g. SIRIUS, DEWE-43) the perfect mobile solution for test engineers and consultants is born.


Image 2: Torsional vibrations recorded with Dewesoft


Torsional and rotational vibration is calculated, as well as the corresponding velocities. The software can compensate for off-center mounting of the sensor and can also take care of the gearbox ratio. Furthermore, the possibilities of Dewesoft allow angle-domain visualization and export.

Using Dewesoft to capture data from other sources: e.g. Video, CAN, Ethernet means that they are perfectly synchronized in one data file. If the powerful integrated post-processing features of Dewesoft are not enough, you can even export the data to several different file formats.

In addition to torsional vibration, the system can be expanded with the order tracking option to complete the picture of the measurement situation.

System overview

As the torsional vibration measurements are very critical in terms of accuracy, only precise counter sensors are supported. At least one (rotational vibration), but usually two (torsional vibration) encoders are necessary.


Image 3: An example of an angle sensor - encoder


A variety of angular sensors is supported:

  • Encoder
  • CDM with zero pulse (Geartooth)
  • Zebra tape sensor (with DS-TACHO4 and auto-gap detection)
  • Sensor with missing teeth (e.g. 60-2)

For example, The CA-RIE sensor has a resolution down to 0.5° and is, therefore, less sensitive to vibrations (which could damage standard encoders over time).


Image 4: Supported angle sensors


Like many additional mathematical modules, the Torsional vibration is an option to the standard Dewesoft package and needs to be enabled in the Math section.

Image 5: Adding Torsional vibration module in Dewesoft


Basic operating concept

The Torsional vibration module inside Dewesoft is just one of several other application modules that offer dedicated mathematics and dedicated visual controls like angle based XY-diagram.

Image 6: Basic operating concept


The user interface of the Torsional Vibration module is split into the following sections: 

Image 7: Channel setup of Torsional vibration math module


  • input: Define the counter channels for input (e.g. CNT 7, CNT 8).
  • counter setup: Define a type of angle sensor (e.g. Encoder-512, CDM-360, ...), and select ratio, if gearing is used.
  • filter setup: The input filter is needed to prevent glitches and spikes in the signal. The Rotational DC-filter needs to be set to cut the DC component out of the RPMs. We need to set the filter to include all wanted frequencies, but not too low, else we will have static DC deviations on the output signal.
  • output channels: Select which calculations are to be done (e.g. rotational velocity, torsional angle....).
  • angle offset: Compensate constant angle offset, off-center mounting, sensor errors.
  • output: Preview of output channels - switch through with the arrow buttons.
  • preview: Preview of torsional angle.

Switch to View Channel List on the right upper corner to see a list of the calculated output channels.

Image 8: View channel list 


There are some typical sensors predefined. However, if your type is not listed, you can define your own sensor in the Counter sensor editor. For torsional vibration module you can use different types of sensors:

  • Encoder
  • CDM with zero pulse (Geartooth)
  • Zebra tape sensor (with DS-TACHO4 and auto-gap detection)
  • Sensor with missing teeth (e.g. 60-2)

Go to Options Editors Counter sensor editor:

Image 9: Path to Counter sensor editor

Click on Add sensor first, then enter a name, and set all other parameters. Depending on the sensor different parameters are available. When finished, click Save&Exit.

Image 10: Add your own sensor


Now the sensor can be accessed from the dropdown menu of the torsional vibration module.

Image 11: Manually defined sensor can be selected in math modules


It is important to know that we actually have two different parameters that can be measured with the torsional vibration module: rotational vibration and torsional vibration.

Rotational vibration is simply the dynamic component of the rotational speed. If we measure the rotational speed of the shaft with high precision, we will notice that we get a high deviation of rotational speed in some regions of the run-up. This is caused by the angular vibration crossing the angular natural frequency of the shaft. It is calculated by cutting off the DC component of the rotational speed or the rotation angle. In the graph below we see two curves, the one above is the RPM, and the curve below shows the deviation in degrees, which is actually the rotation angle vibration. During a coast down the max. vibrations appear at the same RPMs again.

The graph below shows the run-up and coast down where we can nicely see the static twist of the shaft, and when passing through the natural frequency, the angular vibration of the shaft reaches its maximum.

Image 12: Run-up and coast-down of a machine


Torsional vibration is an oscillation of angular motions (twist) which occurs along with rotating parts, such as gear trains, crankshafts or clutches. We need two encoders to measure the torsional vibration, so the torsional vibration is actually a difference between angles of the two encoders. The torsional vibration also measures the static twist of the shaft with higher RPMs.

Image 13: Graphical representation of twist


Required hardwareSIRIUS ACC+, MULTI or DEWE-43
Required softwareDewesoft X, SE or higher + Torsional vibration option, DSA or EE
Setup sample rate

At least 10 kHz

Torsional and rotational vibration can be measured with either an encoder (up to 3600 pulses per revolution) or a special sensor (CA-RIE-360/720) that has a lower resolution (up to 720 pulses per revolution) but is much less sensitive to vibrations that could damage standard encoders.

Image 14: Angle sensor CA-RIE


For our test, we take an electric motor (in the middle) and two encoders. The encoder on the left is connected with coupling and the encoder on the right with a spring to the motor, to create high vibrations.

Because we are currently only interested in rotational vibration, we will only use the encoder on the right side, connected with the spring. The encoder is connected to the Dewesoft instrument on a Counter input.

Image 15: Rotational vibration demo device


As mentioned, there is nothing to be set up in the analog or counter channels setup. Just go to the Torsional vibration module. Next, select the First sensor input. If we have connected the first sensor to CNT 7, we need to select it from the list. Then we define the sensor. If we have 1800 pulses per revolution, we choose the Encoder-1800. If the sensor used is not defined so far, we need to create it in the Counter sensor editor first.

Next, we need to set the Input filter for the counters. The input filter is needed to prevent glitches and spikes in the digital encoder pulse signal. It can be set from 100ns to 5us, the optimal setting is derived from the following equation:

Example: Let's say that our machine is running at 3000 RPM and we have the encoder with 512 pulses per revolution. If we insert this number in the equation above, we get the next result:

The rotational DC-filter needs to be set to cut the DC component of the RPMs. We need to set the filter to include all wanted frequencies, but not too low, or else we will have static DC deviations on the output signal. It can be set from 0.1 to 10 Hz. You have to ensure that your lowest RPM is not filtered out!

A 10 Hz filter, for example, would mean, frequencies below 600 RPM would be suppressed.

Output channels

Image 16: Rotational vibration setup


The output channels are:

  • Rotational angle: Filtered angle value of vibration.
  • Rotational velocity: Filtered velocity vibration value.
  • X-axis reference angle: The reference angle, which is always from 0 to 360 and can be used as a reference for angle based xy diagrams.
  • Frequency: In RPM units.

When you switch to measure mode, the calculated channels of the Torsional vibration module are shown in the channel selector on the right side. The first idea would be to select the TV_Frequency channel and display in analog/digital meter or a recorder. 

Image 17: Run-up can be displayed on a recorder widget


The Sensor_1_angle is the reference angle and can be used for an angle-based display of XY recorder. Add an XY recorder and click on Sensor_1_angle first (=x axis), then on RotAngle_1 (=y axis). Then set the recorder to Angle-based x-y in the properties on the left side. Select e.g. 2 periods to be displayed. This XY recorder now displays the rotational angle of the current revolution. It is like a scope, but with an angle reference instead of a time reference.

Vary the RPM and when you come close to the resonance frequency, the amplitude reaches its maximum.

Image 18: Rotational angle close to the resonance frequency reaches maximum


In the next graph also the rotational velocity is added (first derivation of the angle), according to the theory it is shifted 90 degrees.

Image 19: Rotational angle and rotational velocity are shifted for 90 degrees


The next step is to measure the torsional vibration.

On the left side is an encoder with a rigid (coupled) connection to the motor, on the right side is another encoder. Both encoders are connected with Dewesoft hardware in counter channels. We measure the torsion vibrations of the metal spring in between. 

Image 20: Torsional vibration demo equipment


Add a Torsional vibration module. We need to select both input channels in the Torsional vibration setup. We select CNT0 as the first channel and CNT1 as the second channel. Then we need to define Sensor 1 and Sensor 2 by selecting the correct type from the dropdown menus on the right side. If we have a gearbox in between, we need to enter the Gearbox ratio (it is used for measuring the torsion angle across the gearbox).

As already explained in the rotational vibration section, you can use the input filter for cleaning the signal from eventual glitches, and the rotational filter removes the DC offset from the difference signal.


Image 21: Torsional vibration setup


The Input filter can be set in a range between 100ns and 5ms. The optimal settings are derived from the following equation:

We have the following Output channels:

  • Torsional angle: the Dynamic torsional angle is the angle difference from sensor 1 to sensor 2.
  • Torsional velocity: Difference in angular velocity from sensor 1 to sensor 2.
  • Sensor 1 Rotational angle.
  • Sensor 2 Rotational angle.
  • Sensor 1 Rotational velocity.
  • Sensor 2 Rotational velocity.
  • X-axis reference angle: The reference angle, which is always from 0 to 360 and can be used as a reference in angle based xy diagrams.
  • Frequency: In RPM unit.

In the section Angle offset, you see the angular difference between the two sensors. Click on Zero to remove this static offset. The current average value of the signal will be subtracted. Then click on the y-axis to auto-scale the signal.


Image 22: Angle offset section in Torsional vibration setup


Reference curve configuration

Now there is also an option on how to compensate for off-center mounting and unsteady pulses from the encoder.

Centered mounting is very important. In the first picture (1) there is no problem, the disk is mounted perfectly. However, in real life, off-center mounting like in the second picture (2) will appear. Let's draw on the disk a red line on 0 degrees and a blue line on a 90-degree position. When the disk is turned, the sensor (black box) will count the pulses and after a certain number detect the 90-degree position. But if you look at the disk now, it is far from 90 degrees!


Image 23: Off-center mounting can cause issues


Imagine it rotating, then a constant sine wave will be generated additionally to the rotational vibrations. This can be compensated in Dewesoft using the Reference curve. However, it is required that the load must be removed from the engine! It must be free-running. Otherwise, you would also cancel out vibrations you want to analyze. When the machine is running at idle speed with no real torsional vibration, press the Set button.


Image 24: Setting the reference curve


The current curve is now recorded over one revolution as a reference. After that, the line is much flatter.

Now let's do the measurement. We have added the analog and the digital meter for frequency, a recorder for the frequency, the torsional angle and torsional velocity and we have also added angle based XY for those parameters.

The run-up and run-down clearly shows the static torsion angle and the region of the natural frequency with high torsional vibration values.

Image 25: Torsional vibration measurement screen


To extract orders from a torsional/rotational vibration, we need to add the order tracking module. For the frequency source, we need to define the Torsional vibration module. For this, you select the module created before and Frequency channel(within the module if torsional vibration is used). Next, we need to define the Upper RPM limit and Lower RPM limit. This is used to reserve the memory for waterfall FFT. The waterfall will be drawn from the lower to the upper limit in the Delta RPM step. In this case, we will have (3000-0)/50 = 60 steps of a waterfall.

We choose to extract the first three orders by entering 1;2;3 in the Harmonics field.

Image 26: Order extraction using Order tracking module


Now let's do some measurements. We have frequency and harmonic channels, therefore we can add the x-y display for displaying the orders. The OT_Frequency should be used as x-reference (first chosen channel of x-y), and the RotAngle_1/Amplitude1, RotAngle_1/Amplitude2 and RotAngle_1/Amplitude3 orders should be used as the y-axis. Then we make a run down to observe the orders, where we can clearly see the peak at 2422 RPMs that we previously observed in the recorder being the first order of vibrations.


Image 27: Observing the behavior of orders


To see it even better, we can add the 3D graph. This graph can only show matrix channels. Order tracking has two of them - Order waterfall and FFT waterfall, which can be used as data sources. Now we can start our run up or run down. Since the color shows the amplitude at a certain frequency and RPMs, we need to carefully choose the amplitude scale to show the graph in a nice way. To see also the small amplitude values, the logarithmic y-scale is recommended.

Image 28: FFT waterfall


Image 29: Order waterfall


Furthermore, the amplitudes/phases (or even real and imaginary part) of the Orders can be plotted against the frequency. Again, take the XY recorder, but now set graph type to Single x-axis to get a Bode plot. Here you see the first harmonic (green line) with its maximum around 2400 RPM, matching nicely to the previous measurements. The turning of the phase also indicates resonance.

Image 30: Displaying the amplitude and phase of the orders


One of the standard measurements is, to do the run-up of the machine, and then calculate the max amplitude over the FFT.

Add an FFT analysis function from the Frequency domain analysis section in math.


Image 31: Adding FFT analysis module


Then select the input channel, here for example Torsion_angle. Set to Amplitude, Overall, and averaging type Peak:


Image 32: FFT analysis setup 


Here is an example, done offline on a data file (of course you also can do it online, during measurement). A section has been selected in the recorder instrument below (green line) to only analyze the run-up of the machine.

Then a 2D graph was added (see instrument bar, red box) and the AmplFFT math channel assigned.

Y-axis type can be set to logarithmic in the 2D graph properties (left side) for convenience.

Image 33: Displaying FFT peak results on a 2D graph


You can do the standard export, or just click on the 2D instrument, and use Options Copy to clipboard "Widget data".

Image 34: Copy the widget data to the clipboard


Pasting, e.g. into Excel gives the following result:


Image 35: Pasting the widget data into Excel


The angle-based display of measurement data is often very useful. In the XY recorder you assign the reference angle Sensor_1_angle to the x-axis; then set the view either to:

  • Single x-axis: sees all cycles layered over each other (persistence mode), easy to see min/max overall cycles; persistence can be adjusted with the Pretime limit in the properties.
Image 36: Single X-axis XY recorder


  • Angle-based X-Y: we can see the current cycle - it is working like a scope.


Image 37: Angle based XY recorder


Now, how is it possible to export this cycle-based data? Go to Math and add a Time-to-vector transform.

Image 38: Adding new math Time-to-vector transform


With this great tool, Dewesoft arranges the input data, e.g. Torsion_angle over the Sensor_1_angle in a matrix by resampling the values to the angle base, you also can select the resolution, in this example, we just use 1 degree. The output data is Actual, Average, Minimum, and Maximum over all the cycles.


Image 39: Time-to-vector transform setup


For displaying the matrix data, you have to use a different visual instrument, the 2D graph. Then you can assign the ACT (actual), MIN (minimum), MAX (maximum), or AVE (average) channels from the Math function.


Image 40: Displaying the results from Time-to-vector transform on a 2D graph


Store a datafile, afterward in the Export section only select the 3 matrix channels (in order that data has the same format):


Image 41: Export the data from Time-to-vector transform math


Here we have done the export to Excel, instead of the time axis, we have angle-based data.


Image 42: Angle-based data in Excel


If you copy the data, then use the paste special... function in Excel, you can Transpose columns and rows automatically and get the angle from top-down instead of left to right.


Image 43: Paste transpose to get a better view of the data


Selective export:

Use the recorder instrument to zoom into a section of your data file in Dewesoft (position both white cursors I and II and click between them), then the calculation and export are only done over the selected data.

Image 44: Export will be done only on the zoomed area