An electric current is defined as the flow rate of electric charge past a point. Current exists when there is an electric charge flowing.
The electric current is a physical quantity caused by voltage and means a flow of electrons between different electric potential. An electric current is the flow of the electric charge.
An electric current is defined as the flow rate of electric charge past a point. Current exists when there is an electric charge flowing.
Now let's return to the water analogy of electricity to explain what current is.
Electric current is a physical quantity caused by voltage and means a flow of electrons between different electric potentials (usually from the positive to the negative poles in the case of direct current, this differs with alternating current). This means in the water analogy the current is the actual water flow rate flowing from upstream in the downstream direction. Concretely this means that the current is the flow of an electrical charge between two poles.
As mentioned above there are two types of current, these are direct current (DC) and alternating current (AC). The simpler of the two is DC where the electrons only flow in one direction and the flow is constant, on the other hand there is AC where the electrons change direction and amplitude with the frequency (depending on the grid frequency, in Europe that is 50 Hz meaning that the electrons change direction and amplitude 50 times a second). AC is difficult to explain with the water analogy as water in most cases does not change direction and only flows in one direction.
 Image 1: Direct and alternating current
The cause of the direct current is "direct" or constant voltage, for example, a battery. But for generating an alternating current we need a source of alternating voltage, which is, for example, an AC generator in the power plants. The normal waveform of an alternating current is a sine wave, where the positive half cycle corresponds to the positive flow of the current and the negative half cycle corresponds to the reversed flow of the current.
Now let's take a look at how current measurements are done. The simplest way to do this is using an ammeter. In order to do the measurement, the circuit must be opened, and the ammeter connected in series with the circuit. To affect the flow of current as little as possible, ammeters must have a very low impedance.
 Image 2: Schematic illustration of connecting an ammeter
Since there are many current transducers available for DAQ instruments, current can be measured in a variety of ways. Current measurement is usually divided in two major groups. One is "direct" this is when the conductor must be disconnected and a sensor is connected in series with the circuit. The second type of sensors allows a measurement of current flowing through a conductor without opening the circuit, which means we can measure the current with galvanic isolation of the sensor from the conductor.
The "direct" measurement method of currents works without any additional logic circuits. The most common method used in this kind of measurement is using a shunt resistor, which is then connected in series with the measured electrical circuit.
A shunt resistor is a resistor with a very low resistance that is accurately predetermined by the manufacturer. A shunt resistor works on the principle that it is connected in series with the electrical circuit and as the current flows through it and the voltage drop on the resistor is measured. The voltage is directly proportional to the flowing current according to Ohm's Law, because we know the exact resistance of the shunt. Choosing a shunt with high accuracy is essential because it will actually define the precision of the measurement itself.
\(I=\frac{V}{R} \)
With this method, AC or DC can be measured, but there are a few things that should be considered. Firstly, the declared current of the shunt should not be exceeded as this may burn the resistor. Secondly the shunt will heat up and eventually over heat if the maximum declared current flows through it for extended periods of time. The shunts resistance changes with increasing temperature, and if the shunt overheats the resistance can change permanently. Due to this a shunt is usually only used up to about 60 % of its declared current level.
Further there is the common mode voltage, which we discussed earlier. This might cause some complications in the early stages of the current measurement. An example of this would be: When measuring the current that is flowing through a normal incandescent light bulb using a shunt resistor, the difference in voltage at the amplifier will be very small. Although the measured "voltage points" are still higher than the ground, they can go as high as the grid voltage. If the grid voltage is connected to a 10 V range amplifier the measurement instrument will be destroyed and the only thing left to "measure" will be the sparks coming out of it. To ensure that this doesn't not happen it is recommended to use an isolated measurement instrument.
To simplify measurements with Dewesoft instruments we can choose between two different DSI adapters with an integrated shunt resistor. For example, inside the DSI 20mA adaptor, there is a 50 Ohm 0.01% 0.25W shunt. Below is some information about these shunt adapters in the table.
 Table 1: Dewesoft DSI current measurement adapters
Measurements with these two adapters are simple, as there are no additional calculations to be made. The adapters have built in TEDS that recognize the sensors automatically in the Dewesoft X software. This saves valuable time in sensor configuration, but the conductor must still be split and connected to the sensor in order to do the measurement.
Interrupting the conductor in order to attach the adapter for the current we wish to measure is sometimes not possible. Flowing current can also be measured with current sensors. This is possible because the flowing current causes a magnetic field around the conductors and current sensors measure the intensity of the magnetic field around the conductor in many different ways, current sensors are also galvanically isolated.
A quick overview of the sensors and how they measure current via the magnetic field. These kinds of sensors are isolated from the conductors which mean easier, faster and safer measurements. This type of measurement is safer for both the user and the measurement instrument because the galvanic isolation eliminates the possibility of a high common mode voltage, which is present when measuring high voltage currents with shunt resistors.
We must bear in mind that these kinds of sensors have a phase shift to the output voltage compared to the measured current. The extent of the phase shift depends on the type of current sensor and on the measured frequency. With high accuracy current sensors, the phase shift is nearly zero; with cheaper sensors the phase shift can be more than 10° at the fundamental frequency and even more at higher frequencies. Phase shift itself can be problematic but if we have this in mind when setting up the measurement configuration this shouldn't cause any problems at all. Furthermore, Dewesoft offers an additional sensor calibration in the software (Sensor Editor) which improves the accuracy and phase shift even more.
In the following sub-chapters the following current sensors will be described in more detail:
The following table shows the main differences between the different types of current transducers and the applications for which they are used.
 Table 2: Comparison of different types of current transducers

A Rogowski coil is a simple measurement device which allows an AC current measurement without splitting the conductor. It consists of a helical coil of wire with the lead from one end returning through the center of the coil to the other end so that both terminals are at the same end of the coil. This coil must be wrapped around the conductor where the current measurement will take place. This allows for a measurement to be done without cutting, disconnecting or stripping the wire. The alternating current in the conductor will cause a voltage induction in the coil.
 Image 3: Rogowski coil connected to a Surius DAQMeasurement with the Rogowski coil has several advantages. Rogowski coils are available for measuring very small currents (some 100 mA) up to very high currents (>100 kA). The coil itself is flexible, thin, light and robust. Since there are no magnetic materials, the Rogowski coils cannot saturate and, therefore, has a high overload withstand capability. They are very linear and immune to DC currents which allow for measuring small AC currents with the presence of a large DC component. The bandwidth of the Rogowski coils depends on the type and price and can go up to several MHz.
There are also some disadvantages. Because the principle of measurement with the Rogowski coil is the measurement of the induced voltage caused by the current flowing inside of the coil, which is proportional to the derivation of the current, an integrator circuit must be used on the output side to make the output voltage proportional to the current flowing through the conductor. Therefore, an external power supply is necessary. It's not possible to measure DC currents (exception: special types of Rogowski coils are able to measure DC currents). The biggest disadvantage of the Rogowski coil is the phase shift. The phase shift also depends heavily on the positioning of the coil (vertical and horizontal). This positioning error of the coil cannot be compensated using the Dewesoft sensor editor. But the phase and amplitude error due to frequency behavior can be compensated using the sensor editor.
 Image 4: Schematic illustration of the working principle of a Rowgowski coil
To measure an AC current simply use a DEWESoft current sensor which works with the use of a Rogowski coil. These sensors are integrated similarly to the DSI shunt adapters, with built-in TEDS chips with all the configuration data stored. TEDS only available on certain models.
 Table 3: Dewesoft Rogowski coil product range
 Current clamps allow the measurement of current flows with galvanic isolation. The clamps have jaws which can be opened, and the clamp can simply be clamped around the conductor. The measurement with this clamp is based on Hall's effect or current transformer technology, which means that the magnetic field of the flowing current is used to cause a voltage output on the current clamps.
The iron-core clamp works on the principle of a transformer. Depending on the number of windings on the primary side compared to the secondary side (turns ratio), a certain current will be induced on the secondary side. Like any transformer, this only works for measuring AC current.
 Image 5: Iron core clamp connected to a Surius DAQ
The advantages are that the current clamps are cheap, they don't need an external power supply and they are available for small to very high current measurement ranges. The disadvantages are that they are heavy, inflexible and it is not possible to measure DC currents. Furthermore, the bandwidth is limited (max. 20 kHz).
 Image 6: Schematic illustration of the working principle of an iron core clamp
  Table 4: Dewesoft iron core clamp product range
The Hall Effect is conveniently used to measure both the AC and DC current with a wide amplitude and frequency range (up to 100 kHz) with high sensitivity. For this reason, it is recommended to use hall effect-based clamps to measure DC currents.
 Image 7: Hall compensated clamp connected to a Surius DAQ
The advantages of hall-compensated AC/DC current clamps are the high accuracy (0,5 %), a high bandwidth (100 kHz), the measurement of AC and DC currents and the circuit doesn't need to be opened.
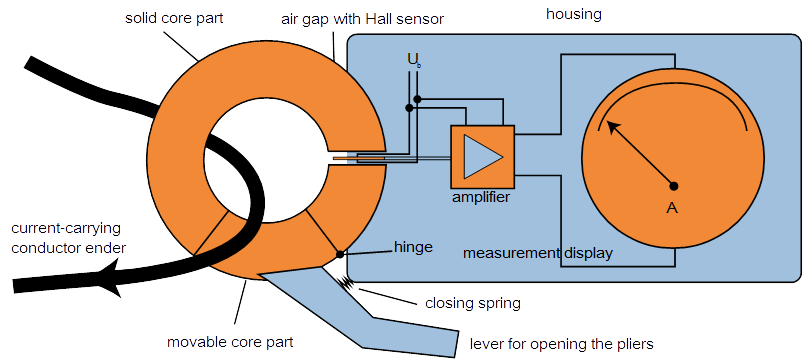 Image 8: Schematic illustration of the working principle of a Hall compensated clamp
Dewesoft offers a variety of clamps that function using the Hall effect for measuring current, these are listed in the table below.
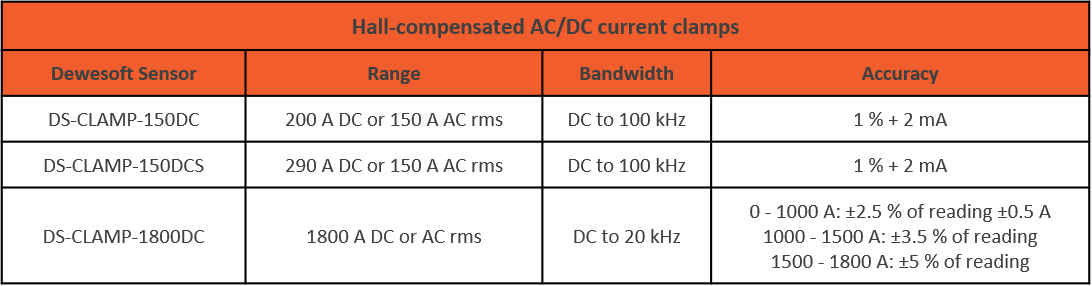 Table 5: Dewesoft hall compensated current clamp product range
The voltage output of these kinds of clamps are also directly proportional to the current. Current clamps also produce a phase shift which can be up to ~10°, but really good clamps can reduce the phase shift to under 1°. The phase shift of current sensors changes with frequency, this is important to remember when doing any power related measurements.
Fluxgate current sensors make use of a high permeability magnetic core in order to ascertain the magnetic field that is produced as a current flows through a conductor. Fluxgate technology depends on a negative feedback circuit, including a magnetic circuit, as can be seen in the schematic image. This is done by reverting a current back through the feedback coil so that the magnetic flux can be canceled out. The magnetic flux is caused in the coil by the current that is measured in the DUT. This decreases the effect of the material's magnetic non-linearity, as it is compensated and can be kept low.
 Image 9: Fluxgate clamp connected to a Surius DAQ
Fluxgate technology can detect current using the DC current detection method. This brings the inherent advantage with it that there is no need to use semiconductors. This enables the current clamps to have a long-term stability as well as a wide temperature stability range and a very low off-set voltage.
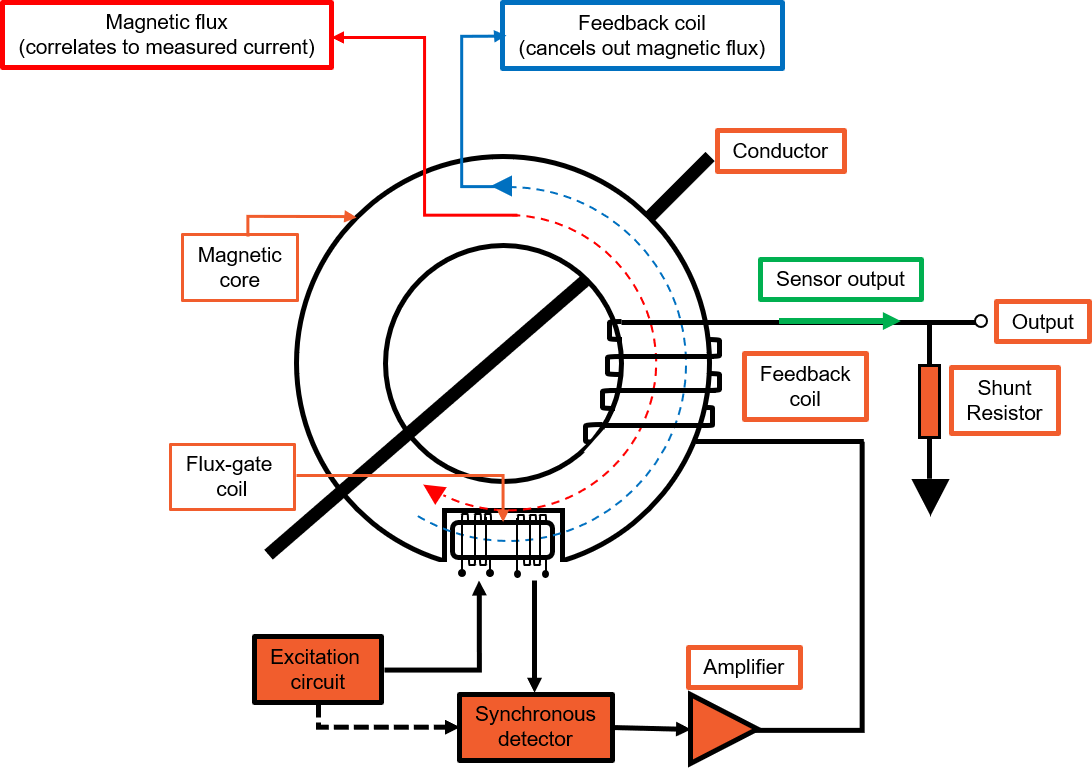 Image 10: Schematic illustration of the working principle of a Fluxgate clamp
Most clamp-type transducers have a lower accuracy than their uni-body counterparts, this is mainly due to the split in the magnetic core that is needed to open the clamp. Fluxgate current clamps are the industry leading clamps when it comes to linearity, bandwidth and temperature drift, second only to the high quality uni-body zero-flux transducers.
 Table 6: Dewesoft fluxgate current clamp product range
Current transducers measure current flows with galvanic isolation. They reduce the high currents to a much lower value. The conductor with the measured current must be guided through the loop of the sensor because current transducers function on the principle of a transformer, which means they have a current output signal and this low current signal can then be measured with the DAQ.
 Image 11: Zero-flux transducer connected to a Surius DAQ
Zero-flux current transducers are not simple transformers, they have sophisticated constructions and integrated electronics. They have two windings which are operated in saturation to measure the DC current, one winding for the AC current and an additional winding for compensation. This kind of current measurement is very precise because of the zero-flux compensation.
 Image 12: Schematic illustration of the working principle of a Zero-flux transducer
This is a very important point because the magnetic core of the transformer stays magnetized with the residual magnetic flux, which destroys the accuracy of the measurement. In these transducers, the parasitic flux is perfectly compensated. Therefore, zero-flux current transducers are used for measuring currents with high precision, but they are not suitable for simple and fast measurement like iron-core clamps or Rogowski coils.
 Image 13: Product line of Zero-flux transducers
Zero-flux transducers are used to measure currents with the highest accuracy for both AC and DC and have high bandwidth capabilities (up to 1 MHz). They are very linear and have low phase and offset errors.
 Table 7: Dewesoft zero-flux transducer product range
For demonstration purposes a IT-400-S transducer will be connected to both a Sirius 4xHV 4xLV as well as a PWR-MCTS2.

The connection will require the following components:
 Table 8: Required components to connect a zero-flux transducer
Step 1: Firstly, connect the zero-flux transducer IT 400-S with the D9m-D9f-5M-MCTS cable to the SIRIUSi-PWR-MCTS slice at the Sensor 1 input. The D9m-D9f-5M-MCTS cable is a simple extension cable and can be used for all zero-flux transducers (60A up to 1000A).
 Image 14: Zero-flux transducer connected to a SIRIUS-PWR-MCTS2
Step 2: Connect the DSI-MCTS-400-03M cable to Output 1 of the SIRIUSi-PWR-MCTS2 and connect it to the first LV input of the Sirius PWR amplifier.
 Image 15: Zero-flux transducer connected to a SIRIUS-PWR-MCTS2 and a SIRIUS DAQ

 Table 9: Different shunt cables used with the zero-flux transducers
Repeat Step 1 and Step 2 for all zero-flux transducers that need to be connected to the system. For measuring a three-phase system with a star connection the connection will look like the image below:
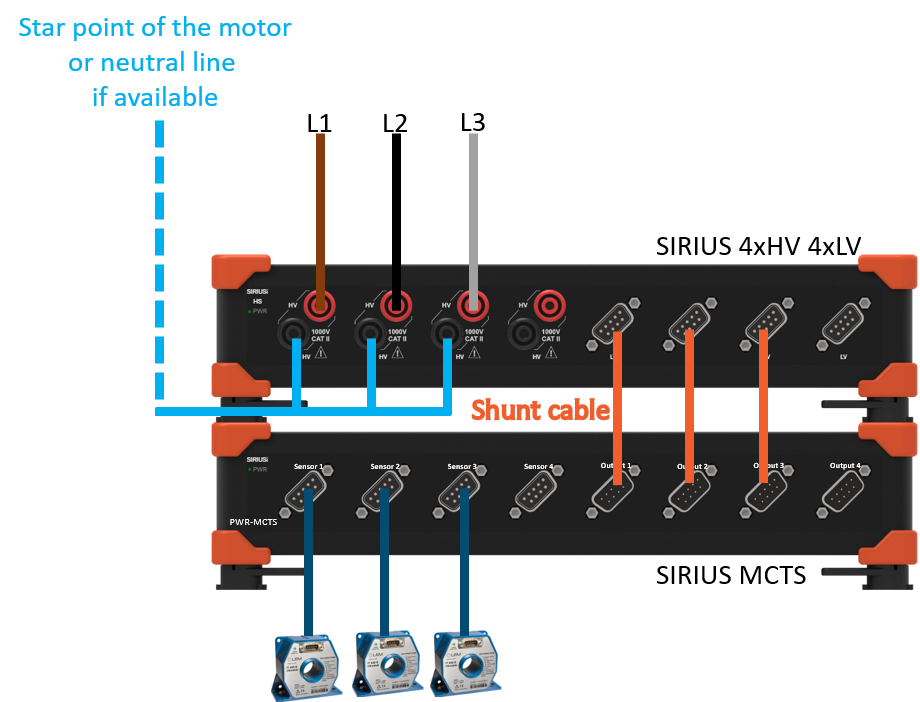 Image 16: Three phase star point connection with zero-flux transducers
Instructions on how to connect voltage and current transducers for all the different wiring configurations such as DC, 1-phase, 2-phase, 3 -phase delta -star -Aron -V, etc. can be found in a later chapter of pro training.

In most of the Dewesoft current transducers there is an integrated TEDS chip, where data such as scaling, calibration etc. of the transducer is stored. When the shunt cable is connected to the Low-Voltage input of the Siriusamplifier all these configurations are done automatically. Therefore, the DSI adapters and TEDS sensors must be activated. Please check Devices Settings and ensure that this option is enabled, see screen-shot below.
 Image 17: Enabling DSI and TEDS in Dewesoft X
After connecting the sensor (e.g. MCTS 400) the software will recognize the TEDS and will automatically fill in the column Ampl.name with the current transducer description (e.g. DSI-MCTS-400), the type of measurement as well as the physical quantity and the measurement unit will be changed to Current.
 Image 18: Automatic sensor recognition in Dewesoft X
Finally, a suitable measurement range should be set, and a low-pass filter should this be necessary, as shown in the image.
 Image 19: Set up screen for transducers in Dewesoft X
Current transducers are used to monitor the current flow in the public grid and protect the equipment from overloading. A current transducer is easily explained as a transformer which is operated in short-circuit on the secondary side (or with a small load). On the output (secondary) side of the current transducer, there is a low current signal which is directly proportional to the current on the primary side. In public grid operation, the secondary current is standardized with a level of 1A or 5A.
![]() Image 20: Public grid monitoring
Image 20: Public grid monitoring
There are different measurement classes of current transducers which describe the accuracy and the phase shift of the transducers. The classes range from 0,1 to 5. Class 0,1 means that the accuracy of the measured amplitude is 0,1 % and the phase shift is ±5 minutes. In class 5 the accuracy is 5% and the phase shift ±120 minutes.
The description of the current transducers also defines the overload factor, the rated power (load) and the application of the transducer (protection, measurement). The load (input resistance of the measurement device) is important because it influences the overload capability of a current transducer. If the load is higher than the rated load, the transducer will go into saturation prematurely and, therefore, will lose the overload capability.


As an example, a classic 40 W light bulb will be measured. Noticeable is that the load on the grid is linear to the voltage. The measured power is exactly 40 W as it should be, but in the vector-scope as seen in the image below things are not quite as they should be. A light bulb is a purely ohmic load on the grid and therefore the voltage and current should be perfectly aligned (no phase shift). What could be the reason for this?
In previous chapters the differences between current transducers and shunt resistors were explained, it was mentioned that these may cause a phase shift when carrying out measurements (the extent of the phase shift relies greatly on the quality of the sensor that is used). This is exactly what can be seen in the image below, the current transducer used for the measurement is causing a phase shift in the vector scope and this is negatively influencing the measurement that is being done.
 Image 21: Phase shift caused by the current clamps
Luckily in the Dewesoft X software, there is the option to rectify this phase shift and it will be compensated to reduce the chance of measurement errors. Here is how to do it:
As mentioned earlier all current transducers have frequency dependent behavior regarding the amplitude and the phase. In the Dewesoft X software the compensation is done in the sensor editor, this will make the measurement with the sensor much more accurate. This is achieved by using the specifications that the manufacturer of the sensor supplies with the sensor. This is unique on the market of DAQ systems, as the math is done automatically in the Dewesoft X software!
By navigating to the Options and under Editors choosing the Analog sensors, there will be a list of known sensors that can be chosen from, and there is the option for the user to add sensors that are not on the list. For this example, a sensor is added, enter the sensor type and the serial number. Enter the Physical (input) unit, which is A (amperes) in this case and the Electrical (Output) unit, which is V (volts). Image 22: Analog sensor editorThe next step would be to add a SCALING factor (this is mostly supplied by the manufacturer). In this example the sensor is linear with the amplitude, only the scaling factor needs to be added, in this case it is 1 as (1A = 1V). The polarity in this step is not that important as it can also be changed (reversed) in the channel setup at a later stage.
 Image 23: Scaling factor
This is the most important part -> defining the TRANSFER CURVE. In the table under the transfer curve column select YES to signify that a transfer curve will be defined. Now the points of the curve need to be added:
Where does one obtain such transfer curves? There are many transfer curves available for the most common sensors that have already been measured, so it's worth checking if it already exists. Secondly the transfer curve can be copied from the calibration sheet if it is included.
A third option would be to measure it with the FRF (Frequency Response Function) option, but this requires some equipment. When the transfer curve is obtained, it needs to be entered into the table. As can be seen in the image below at 50 Hz the angle is around 10°, this explains the phase shift that was seen in the vectorscope.
When the sensor set-up has been done, save it with the save file button and exit the sensor editor with Exit. Then go back to the analog set-up and select the sensor for the current channel. Open the Sensors tab and select the serial number of the sensor previously entered in the Sensor field of the editor. Nothing much happens but note that the normal scaling or sensitivity cannot be entered any more. To reverse the polarity of the sensor, choose the Scaling by function and select Sensitivity. By clicking the ± button, the polarity can be reversed.
 Image 25: Channel setup in Dewesoft X
The sensor has now been set-up and the Software should auto compensate the phase shift automatically. This sensor set-up does not have to be done again as it has been saved to the sensor list (database), if needed just select it from the sensor list and the set-up will be ready to use. The image on the next page shows how the sensor correction affected the measurement. The results are now correct, the phase angle has been virtually eliminated and the power is calculated correctly.
 Image 26: Phase angle has been eliminated, power is calculated correctly
Now some current measurements will be done using DEWESoft equipment. The measurement will be done on two light bulbs, to determine the current consummation of a classic 40 W and an energy-saving 11 W light bulb. In this measurement two approaches will be used, the first being a direct voltage measurement using a shunt resistor and the second using current clamps.
Before the measurement can commence some calculations need to be done. These calculations will determine which SIRIUS amplifier and the range of the amplifier needs to be used as well as the type of current clamps.
When both light bulbs are switched on simultaneously the declared power will be 51 W and the RMS value of the grid is 230 V, these are the variables that we need to do the calculation. Below is the calculation.
\[ P_1 = 40 W \] \[ P_2 = 11 W \] \[ P = P_1 + P_2 \] \[ I =\frac {P}{V} = \frac {51 W}{230 V} \approx 0.22 A \]
After the rough calculations have been made the current RMS will be approximately 0.22 A. But we need to consider that the max value of the sine wave signal is 2 times the RMS value, but since the energy saving light bulb doesn't use the current in sine waveform we should have some reserve in our measurement ranges due to the higher crest factor of the energy saving bulb. This taken into consideration a 10 A range is chosen on the current clamps and the shunt an DSI SHUNT 5 A adapter. The shunt has a resistance of 0.01Ohm meaning that 1 A of current will cause a voltage drop of 10 mV in the shunt. This information is necessary for the measurement channel set-up that the voltage drop of the shunt will be measured on. The Dewesoft DSI adapters are already equipped with the channel set-up information (integrated TEDS), so the software can configure the channel set-up automatically. This is just one less thing to keep in mind when Dewesoft DSI adapters are used for measurements.
The measurement can now be started. For this measurement two different Sirius amplifiers, a LV module and an ACC module will be used. Below on the image is shown what the measurement set-up looks like when all the components have been connected. The current clamps are directly connected to the LV module and the DSI SHUNT 5A is directly connected to the ACC module.
 Image 27: Equipment for demo measurement
As the image illustrates the wires must be split for the shunt installation. Please be careful when doing this as it can be dangerous due to the grid voltage. Next the channel configuration of channel 1 (shunt channel) is done. It is recommended to rename the channel to keep a clear overview of which components are connected to which channels (to do this simply click where it says channel name and type the chosen name in), in this example the name shunt current was chosen for the channel name.
Secondly the physical quantity will be set to current, the unit which is A (Ampere) is set automatically by the Dewesoft X software. Once these settings have been changed it is recommended that the sensor should be calibrated. In this example a 2-point calibration will be chosen as it is already known that 1 V will equal 10 A. These two values are simply typed into the supplied space on the bottom right of the screen. If the parameters were set correctly and the classic 40 W light bulb is switched on, the sine wave from the current will be displayed in the lower left corner of the set-up screen on the scope. Please refer to the image on the next page.
 Image 28: Channel setup for shunt current
For channel 8 where the current clamps are connected, the settings will differ a little from the shunt (Channel 1) set-up that was done before, this is mainly due to the fact that the current clamps are connected to the HV part of the Sirius instrument. The current clamps are set to a range of 10 A which means that they yield 1mV/1mA output (the scaling factor is 1). This means that an output of more than 10 V is not possible, therefore that amplifier will be set to have a range of 50 V this is to ensure that the resolution is sufficient for the measurement. The physical quantity must be set to current again and the unit will again automatically switch to ampere (A).
The image below illustrates what the combined waveform of the energy saving light bulb and the classic light bulb would look like when they are switched on simultaneously. The waveform changes due to the non-sinusoidal waveform and the high crest factor of the energy saver light bulb.
 Image 29: Channel setup for the current clamp
When switched to the measure mode screen, the phase shift of the current clamps compared to the shunt resistor can be seen, as illustrated in the image below. The phase shift does not seem too big at first glance (it is at around 10°), but with applications such a power measurement, the phase shift is a critical component in order to yield the correct results for measurements.
This means that the 10° phase shift that is present in the measurement at the moment can have a significant influence on the measurement results, especially when doing a detailed power analysis (especially for reactive and apparent power). Again, this phase shift of the current can be compensated using the sensor editor, as was explained earlier.
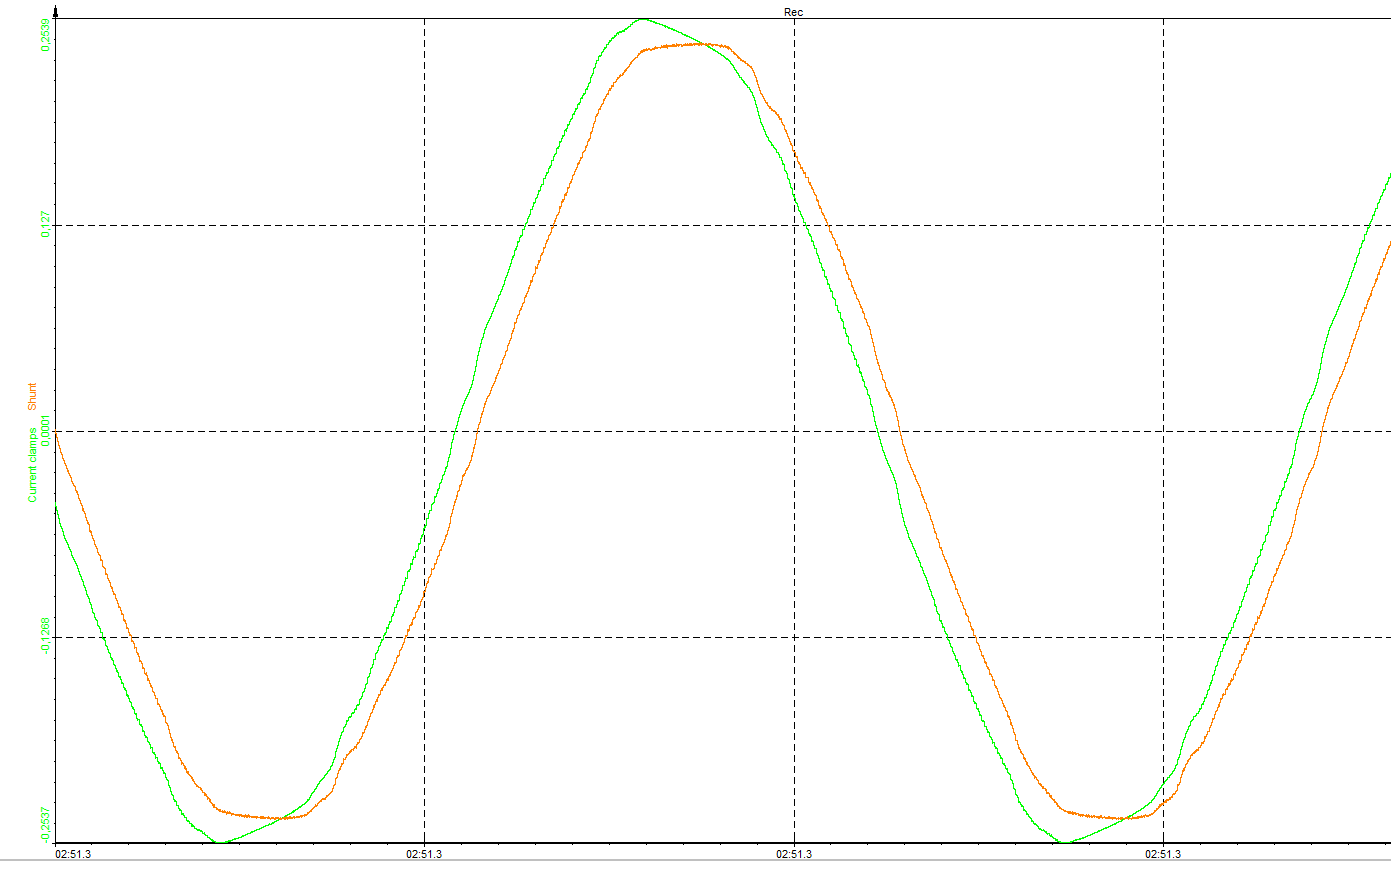 Image 30: Phase shift between the current clamp and the shunt resistor
There are two possible ways of displaying AC RMS in the power module
The basic statistic method
To see the RMS value of the current signal, add a Basic statistic math function. Select the math symbol on the main dashboard, that will open the math module where there are four choices, add math which has a selection of predefined math functions that can be chosen from. Then there is the formula module where the user can enter any math formula imaginable. The next box is the Infinite impulse response (IIR) filter here an array of filters can be chosen from. Lastly is the basic statistic box is this will yield the set-up screen as seen below. Select the input channel (current signal) in this case I1 and the RMS as the output channel. It can be selected to display one value per measurement or it can display new values for each defined block. (For more information on the functionalities of the basic statistics tool please press F1 on the keyboard while the basic statistics tool is open and it will automatically open a web page with useful information and tips).
 Image 41: Basic statistics setup
Using the Recorder
The second option that is available to display the RMS value of the signal is to do so directly in the measurement screen using the recorder. As seen in the image below there are two scopes, one displaying the real value of the AC current and one displaying the RMS value. (Tip: under the recorder options there are four options, one of them which is Unified properties, this is selected as a default and means that the when the real value is selected that will be the case for both the recorders when deselected one recorder can display the real value and one recorder can display the RMS value as is the case in the image below). To display the RMS value, navigate to under the Y-Axis options and select Display type, in the drop-down list select RMS (Bottom left of the image).
 Image 42: Displaying the RMS value of recorder