Simple Measurement Using Sound Card and Web Camera

Perform a simple measurement with Dewesoft X2 software and a sound card and a webcam. Set the measurement channels, make a measurement and analyse data in our software. In the end, you can also make a report and export you data to several formats.

This lesson will first show you how to do a simple measurement with Dewesoft X. The hardware used is a sound card and a webcam.

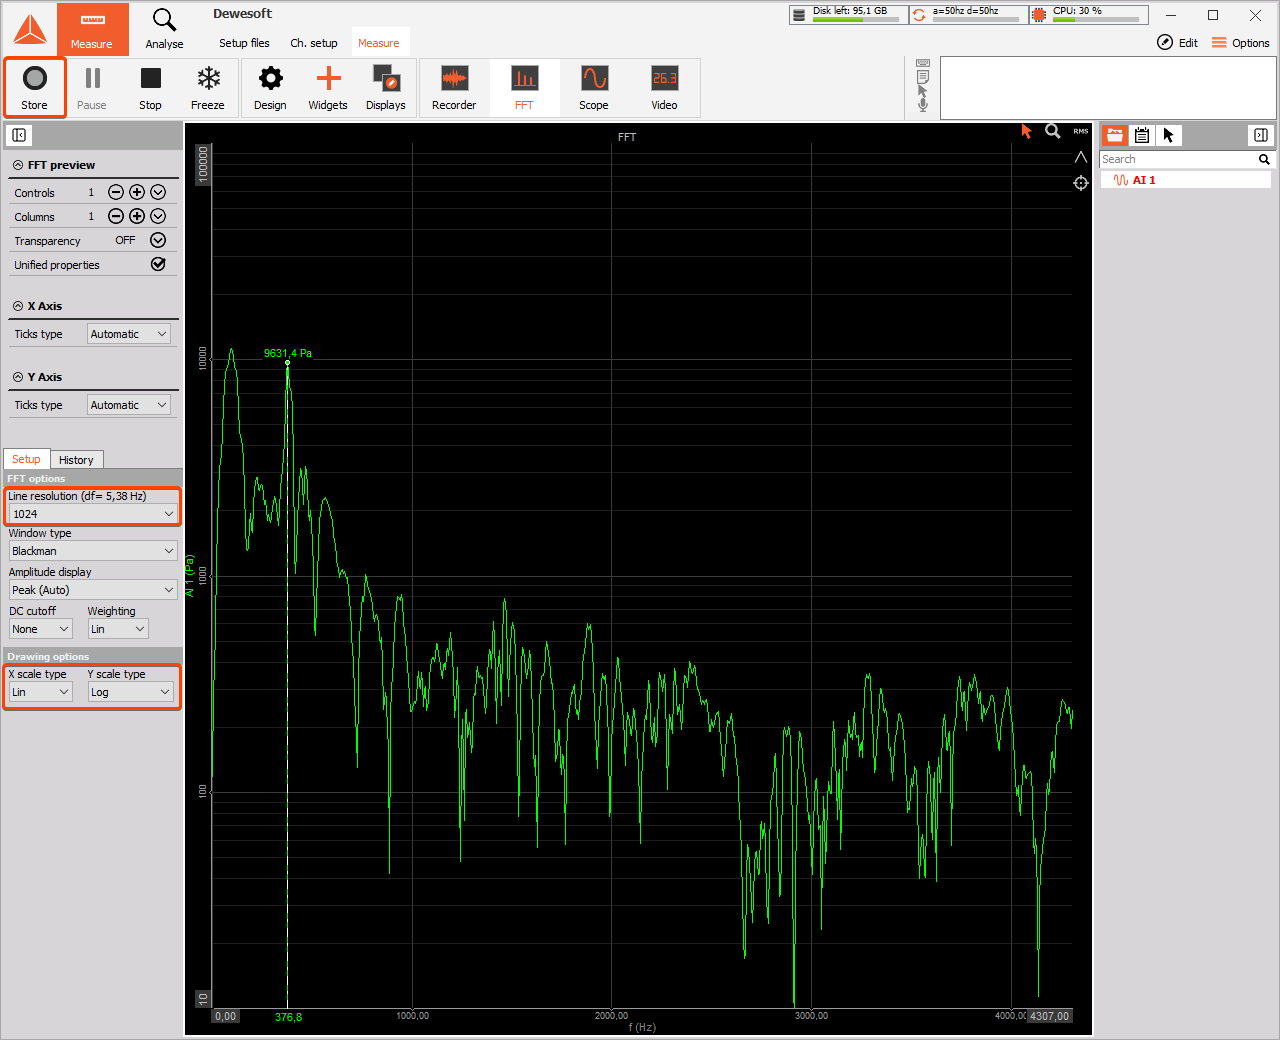
First, you have to download Dewesoft X software from our page. Download and run the Installer. To follow this tutorial, you should have a physical license (professional or trial .lic file) in the Dewesoft, and also the webcam plugged in. Now you can choose DirectX camera in the Settings.

Camera settings menu
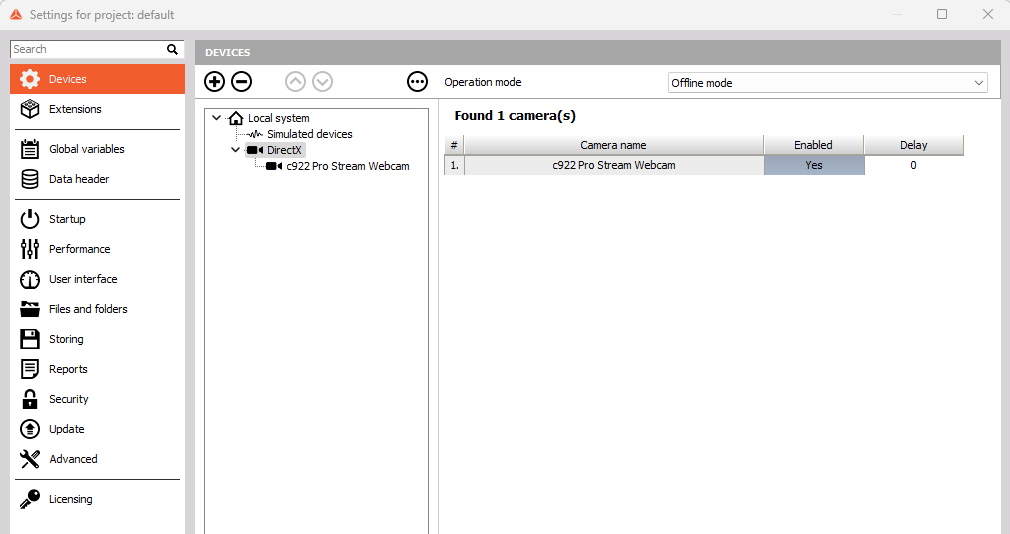
Image 1: Devices settings menu


You can download the Audio card from our Webpage (SB_v3_0.zip). Copy the .daq file to the Dewesoft X installation folder (if Dewesoft X is installed on C, the link would be: C:\Dewesoft\Bin\X2\Addons).

Now run Dewesoft X as an administrator.

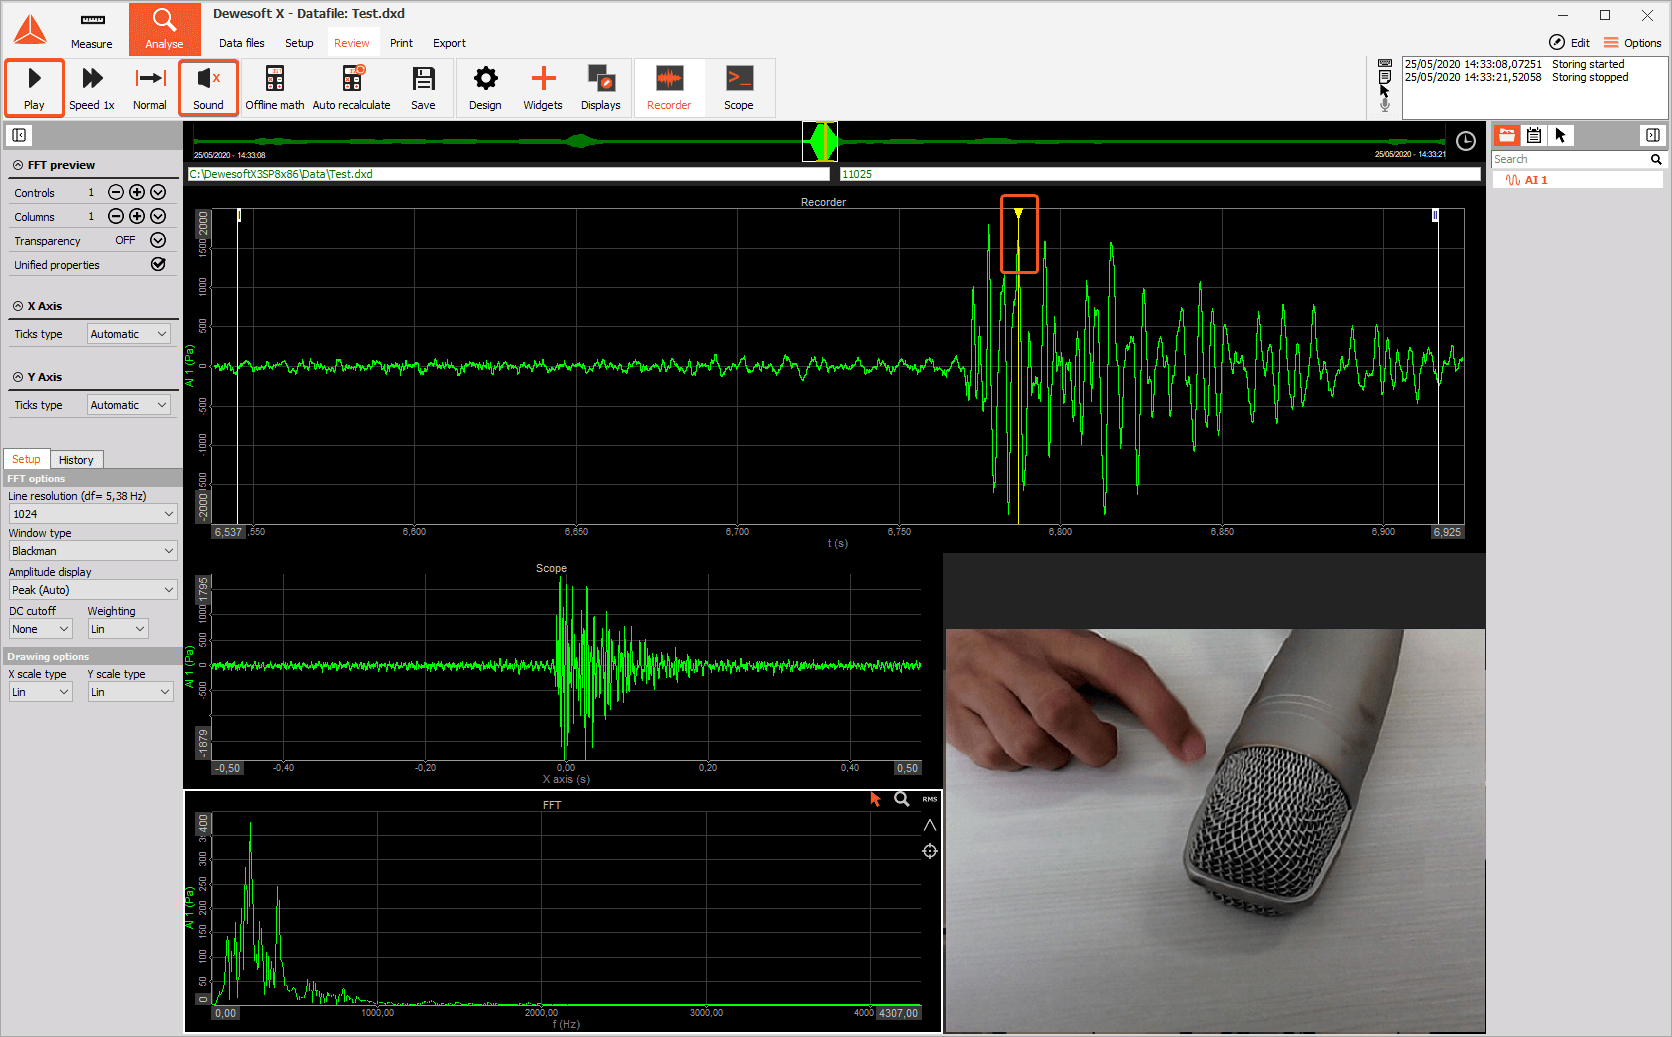
You can activate the Audio card in three simple steps in Device settings:

  • make sure that operation mode is in "Simulation" 
  • click on simulated devices
  • change simulated channels mode to "Sound card''

The Sound Card funcionality can only be used in Simulation mode.

In the DAQ settings section, you can see your active audio devices.

Activating audio devices
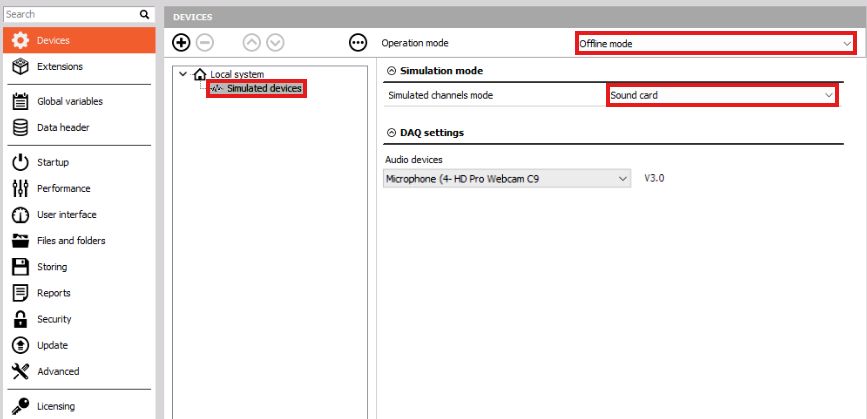
Image 2: Activating audio devices


Even though there is not much instrumentation used in this example, it still gives the user a good example of what can be done in Dewesoft X software.

The following table displays the required hardware and software for completing this lesson.

Required hardwareSound card, webcam
Required softwareDewesoft X, any license
Setup sample rateAt least 1 kHz (the setup sample rate is chosen in Settings -> Global setup - > General -> Setup sample rate; some math modules require higher rates)

In the upper left corner of the screen, you can find two main tabs - Measure and Analyse. They are used to switch between Measure mode to acquire the data, and Analysis mode to process the data.

Two main markers
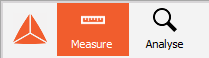
Image 3: Two main tabs


See all possible properties and adjustments for the analog channels.

Click the Ch. setup button. After that the channel setup screen will be opened, where you will see the Analog section with two analog channels (stereo), a Video section, and the Math section.

Channel setup screenImage 4: Channel setup screen

In the Storing section, you can enter the file name and place on the computer where the files will be stored, in the Analog section, you can set up the sample rate.

The sample rate is the basic speed with which data will be acquired. This rate needs to be chosen wisely according to the specific situation. If the temperature is measured, we might need only 100 Hz (samples per second) or even less. If the number, that is chosen is too high, we will waste disk space, yet gain no additional information.

In this lesson, we will measure sound, so we have to choose at least a sample rate of 10 kHz (10000 values per second) to really acquire sound correctly. For good audio performance, we should choose 40 kHz or more.

Next, the appropriate channels need to be selected. Since only a simple microphone is used for this example, only one channel is sufficient. Users/ can select it by clicking the on/off button. Note, that there are Setup buttons on the right side of the list.

Even though this is a simple microphone, the importance of correct measurement should be emphasized. First we need to define the Units of measurements. The physical quantity measured by a microphone is a sound pressure measured in Pascal. Pa should be entered as the unit.

Microphone channel settingsImage 5: Microphone channel settings

 Next we will try to perform a simple "calibration". Sound is calibrated with a sine wave. We can try to make a nice sine wave with a whistle. The RMS value of the signal rises to a certain level and we can use the Calibrate from the RMS button to equalize the level to what might be approximately 1 Pa. A real microphone is calibrated exactly with the same method as used in this tutorial, but we can trust that the calibration value will be 1 Pa with the real microphone and calibrator.

Here is an example of how to set up a web camera.

The next step is to set up the video channel. Go to the Video section. In the CAMERA OPTIONS section where the webcam should be displayed if it is installed correctly. Click the Unused button to switch on the camera and end setup with the Setup button.

If the camera is not recognized, go to Settings in the right upper corner of Dewesoft X, press the Devices button, and after that press the
button. Add device field will open and you will be able to add the camera that you are using.

Video channelImage 6: Video channel

Here, we can change the frame rate, resolution, compression, and other properties of the camera. Details about camera setup are explained later, but let's stay with the simple setup at the moment.

Camera setup windowImage 7: Camera setup window

 We are now ready to take the first measurement.

It is possible to add and adjust different widgets for the signal input.

Click the Recorder button in the upper section. The Settings will start to acquire the data. We can now test how the microphone works by making some sounds. We can use the plus or minus button on the lower right side of the display to zoom in or out of the time axis.

Data shown in RecorderImage 8: Data shown in Recorder

To see the data at the faster rate, switch to the Scope screen. On the trigger tab, select the Norm trigger and the drag level L1 with the mouse to about 10 % of the full range. One can now tap on the microphone to create trigger shots. It will be nicely distinguishable how different sounds create different patterns.

Scope screenImage 9: Scope screen

Next the FFT screen can be used to perform the frequency analysis.

FFT screen can be added in the Widgets marker. As you will see there are several visual controls available, including the FFT.

Widget menuImage 10: Widget menu

A nice line resolution and logarithmic scale are helpful to better see the harmonics (in the screenshot below there are 4096 lines to have approximately 1 Hz between each frequency line). 

Here you can try to sing your best A note (A3 has a frequency of 220 Hz, A2 has a frequency of 110 Hz) or, if you have a piano or any other musical instrument available, one can see how well it is tuned. It is also nice to see the difference between a whistle, singing, and a musical instrument. Actually, the higher harmonics give the color of the tones of music.


FFT graphImage 11: FFT graph

Now you can go back to the recorder and you will see that all the data is still there. You can zoom out and observe the full period of time you or someone has played with the microphone. 

The next step is to store some data. Click the Store button and the red light on the "store" button should appear. The upper right corner should display the size of stored analog data and the video file size.

In this chapter is described how to design a well transparent measurement screen.

The previous example was about how to use separate instruments. In Dewesoft X, it is possible to combine those instruments to create great looking displays. Actually, any display can be changed according to the user's wishes. Let's change the Overview display, which is intended for combining instruments.

First, please note the Design button, which is located right next to Measure. When Design is clicked, the bar with available instruments appears. We can add all the instruments that were used independently before. Let's add a recorder, scope, and FFT. We can drag and resize the instruments to fit our needs.

Don't forget - we have also a video. Click on the icon with the camera ("Video" icon) on this bar to add the video screen.

To zoom in/out or to change the trigger levels, the user needs to quit the design mode by clicking the Design button again. This removes the instrument bar and enables the user to utilize the full functionality of the displays. Now, one can practice setting these basic instruments to have a nice overview of the measurements.

Example of well designed measurement screenImage 12: Example of a well-designed measurement screen

Remember that we are storing the data? Click the Stop button to stop storing.


See all the possibilities on how to review the stored data.

The next step is to look deeper into how we can analyze the data being stored.

It's quite simple - just click the Analysis button. Since we just stored a data file, Dewesoft X assumes this is the file that we want to review. If the user clicks Analysis in other cases, (when launching Dewesoft X or from the setup screen), the file explorer would open up and we can see the subfolders of the main data folder, the file list and detailed information about the chosen file such as size, start store time, version, sample rate, number of channels, storage options and video files (if there are any).
Double click on the file which was previously stored.

If there are subfolders, we can select them by double-clicking on the subfolder.

The first level data folder can be changed by clicking on the folder list drop-down and selecting any upper-level folder. The default folder can be saved by clicking on folder drop-down and selecting Set as the default project folder.

When the user selects a certain file, it is pre-scanned to display important information about channels, events, and data header. This information is shown in the General file information section and on the Channel info list below the file explorer. Note that there is also a Min and Max available and that if the channel is overloaded, this will be shown in red.

Measurement dataImage 13: Measurement data

 Now we can open a file. The user can choose any display that was pre-built in Acquisition mode. 

There are many ways how to review the data file. On the upper right side, there is a Play button. When selecting this, you will see that the yellow cursor moves through the data, FFT is calculated, the scope shows the current data and the video file is replayed. When the replay starts, the "play" button changes to a Stop button. Clicking on this button stops the replay. We can even hear the sounds we have just stored. Next to the play button, there is also a Sound button, but with the red cross. Clicking on it displays the channel list. By selecting the only stored channel, the loudspeaker will not have a red cross anymore. Now click the Play button again and whatever was have recorded will be heard from the loudspeakers. Click Stop again to stop the replay, and select None on the loudspeaker icon to switch off the audio replay.

While playing the data, you have noticed that the yellow cursor moves through the data. You can also drag this cursor with the mouse to move through the data file quickly.

The yellow cursorImage 14: The yellow cursor

 If the data file is really big, it can be very useful to zoom in on a specific section. Please note that, additionally, the recorder has an additional two silver cursors - named I and II. The user can drag these cursors to select a certain region.

Another way of selecting a specific area is to left-click and hold the mouse button on an empty area of the recorder (where no red events or cursors are present). This will position cursor I in the specified area so that the user can then drag the mouse to the second location, which will position cursor II.

When this is done, the mouse icon will change to a zoom icon within the region between cursors I and II. Clicking the left mouse button will zoom in on the recorder. This can be done several times to come to the region of interest. The user can also drag the x scale left and right to position the data exactly. Right-clicking on the recorder will zoom out to the full scale.


In Dewesoft X it is also possible to output the recorded signal.

A signal, recorded with a microphone or any other sensor, can be replayed and played through speakers in analysis mode in Dewesoft X.

Under the Sound section, we have to choose the Output channel, that we want to replay (only one channel at the time can be selected).

Selecting the output channelImage 15: Selecting the output channel

The de facto standard for the sound replay is 44100 Hz, due to human hearing and signal processing. Sound cards will replay files with the following rates directly (without resampling in software):

  • 11025 Hz
  • 22050 Hz
  • 44100 Hz (default rate for sound reproduction in Red Book standard from 1980)
  • 88200 Hz
  • 176400 Hz
  • ....

In order to replay the recorded sound data in the best possible way, the acquisition sample rate must be set to one of the standard rates for sound reproduction. The formula to calculate the nearest rate in Hz is 11025 * 2n (where n = 1, 2, 3,...). Recorded sounds that are higher than 44100 Hz needs to be bandlimited first. For that purpose, a low-pass FIR filter can be used (look at the filtering section).

If the sample rate is different from the standard one, Dewesoft X uses linear interpolation. Linear interpolation is a bad choice for signal reconstruction and resampling filter since it is a non-continuous step function and it introduces harmonic components in the frequency spectrum, which are multiple of the main harmonic.

This resampling effect can be heard more or less:

The effect will be masked in some way, when:

  • the frequency of the sound is low compared to the sampling rate
  • a lot of frequency components are present in the spectrum by default


The effect can be clearly heard, when:

  • sound frequency is close to Nyquist frequency of the band limited signal
  • pure tones are played

Example: An example was made with a single tone sweep signal from 5kHz to 10kHz.

Sound_ResamplingImage 16: Sound Resampling

 The green line represents the original signal, recorded with Dewesoft X and Sirius.

This recorded signal was then replayed and again recorded with Dewesoft X. We can see that the replayed signal contains harmonic components because the original signal was not sampled with 44100Hz and is, therefore, linearly interpolated.

Conclusion: for best sound quality replay in Dewesoft it is best to use one of the standard sample rates (direct play through the sound card at 11025, 22050 and 44100 Hz). 

Instructions and options for exporting the data.

What can we do now with this data?

First of all, we can print the current page. Just click the Print button and the same page (with white background, to be "printer-friendly") will appear. You can select different print options and click the Print button in this menu to print the data.

Reporting and exportingImage 17: Reporting and exporting

The next step is to export the data to other applications. Dewesoft X is intended to be an acquisition application, thus for advanced analysis, we can use other post-processing applications. This can be done by selecting the Export button. We can then choose to export the data to MS Excel or Flexpro. The user can even choose the script - which actually means the measurement reports. We can also choose File export and have a vast choice of post-processing applications, but for this example, there is only the data file.

It is important to note that in this example we will export only a zoomed region. If we have MS Excel installed on the computer, it is not recommended to choose too much data for testing this feature, since Excel can't really handle a lot of data. For larger data files, it is recommended to use Flexpro or Matlab.

Microsoft Excel exportImage 18: Microsoft Excel export

Another interesting option is to make a video of the screen as it is replayed. We can do this by selecting the menu item Edit → Export screen to AVI. This will actually produce the video file like it would be played on the Dewesoft X screen. 

This is a short overview of what can be done with very basic hardware. There are many possibilities for what can be done with professional equipment. The measurement tutorials will demonstrate how to perform real measurements.