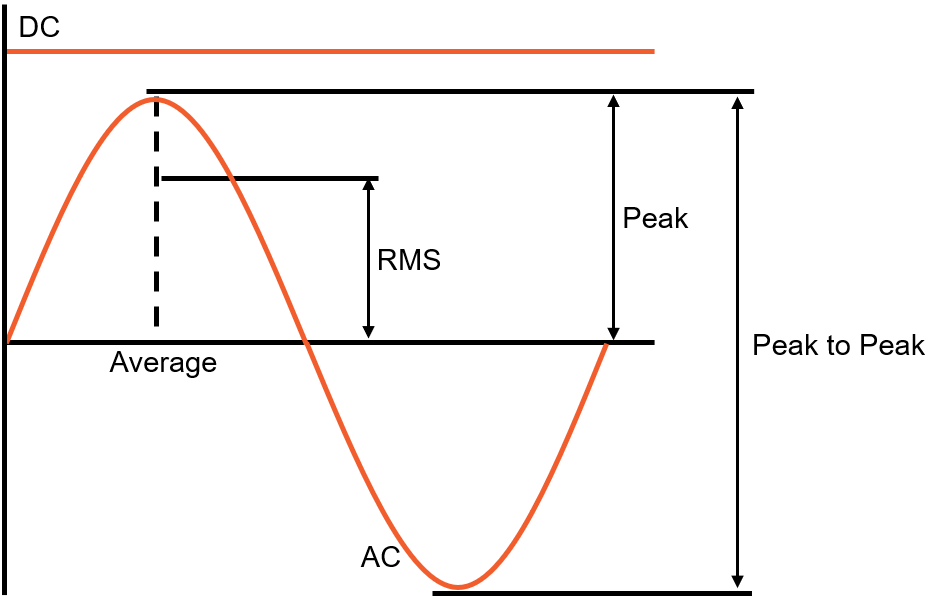
Following the theory, a practical example of how the Dewesoft measurement instruments work will follow. The voltage of the public grid will be measured. The value input voltage of the public grid must be considered to identify what type of amplifier input is needed for the measurement. The public grid in Europe is declared with a value of 230 VRMS but to ensure safe operation of the measurement instruments the peak values of the grid must be considered for the input range. The peak value of the grid in Europe equals the RMS value multiplied by the square root of 2 as seen in the equation below.
\( 230V_{RMS}\cdot\sqrt{2}\approx325V_{peak} \)
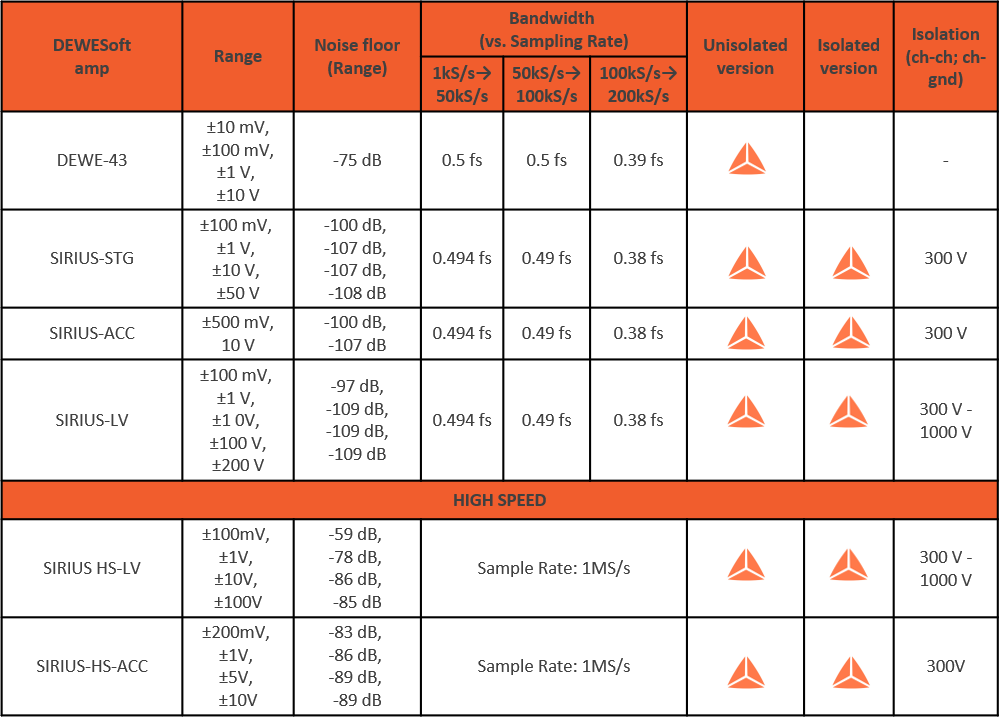
With a peak value of 325 V, we can directly use a Sirius HV-HS module that supports voltage up to 1.6 kV. This means that we can make a simple measurement without any additional voltage dividers or amplifiers and a simple connection as illustrated below. Channel 4 will be used, which has a Sirius HV-HS amplifier integrated into it. The other channels can be left inactive (unused in the software) as they are not relevant to this measurement. The next step is to configure the measurement channel setup in the software as illustrated below.
 Image 17: Single-phase voltage connection to a Sirius 4xHV 4xLV
 There are two sides for the set-up window, the left side is the amplifier side and the right side is the sensor side.
 Image 18: Channel set up a screen in Dewesoft X
On the Amplifier side, we can toggle between the 50 V and 1600 V range. In this example, the 1600 V range will be used. A Low-pass filter can also be used to cut off the higher frequencies, but caution should be taken when doing that. If a frequency lower than half of the sample rate is taken it will cut the signal in the measurement range, this might be useful in some applications but mostly this configuration is set by mistake.
The setup on the Sensor side is about selecting which sensor is used for measurement. In this case, the voltage is directly measured without a sensor, so only the physical quantity must be set as Voltage and the unit as Volt (V). In this part of the setup, the scaling factor can also be set if sensors or dividers are used for the measurement. In this case, it will have the value 1 as the voltage is measured directly and no scaling is done.
For this example, the settings are done so the measurement can be started. By clicking on the Measure button. The best way to observe a sinusoidal waveform is with the scope. When the scope is first opened there will be a running wave that is impossible to analyze, this is due to the fact that the software is running in free mode, and the measurement needs to be held somehow. It is recommended to add a trigger on the norm trigger and defining the source and the trigger level. For the purposes of this example, it can be left as it is, as the trigger source is the U1 channel and the level equals 0.
 Image 19: Measurement screen of voltage with a simple trigger
 DualCoreADC Mode
In the previous section a lot was said about proper amplifier measurement range selection. Now it's time to take a look at the impressive options offered by the dual core mode in the Sirius amplifiers. When using the Sirius dual-core mode it is possible to get a better resolution (less noise) at low amplitudes. That is solved with two 24-bit AD converters with different ranges on each channel.
The first AD converter has a full input channel range and the range of the second AD converter is only 5% of the full channel range. This technology measures the signal with low and a high gain simultaneously which means that the signal can be measured with a relatively high amplitude but at the same time it has a perfect resolution at low amplitudes of the same signal.
Let's take a look at the difference between dual core mode and normal mode when measuring low signals with a high range:
 Image 20: Enabling the dual core mode in Dewesoft X
In this example a 0.3 V DC signal from the calibrator on two ACC amplifiers will be measured. On both amplifiers, a 10 V range will be chosen (which is complete nonsense) but it's the easiest way to see the difference between dual core mode on or off. This can be toggled in the channel setup where range can also be set.
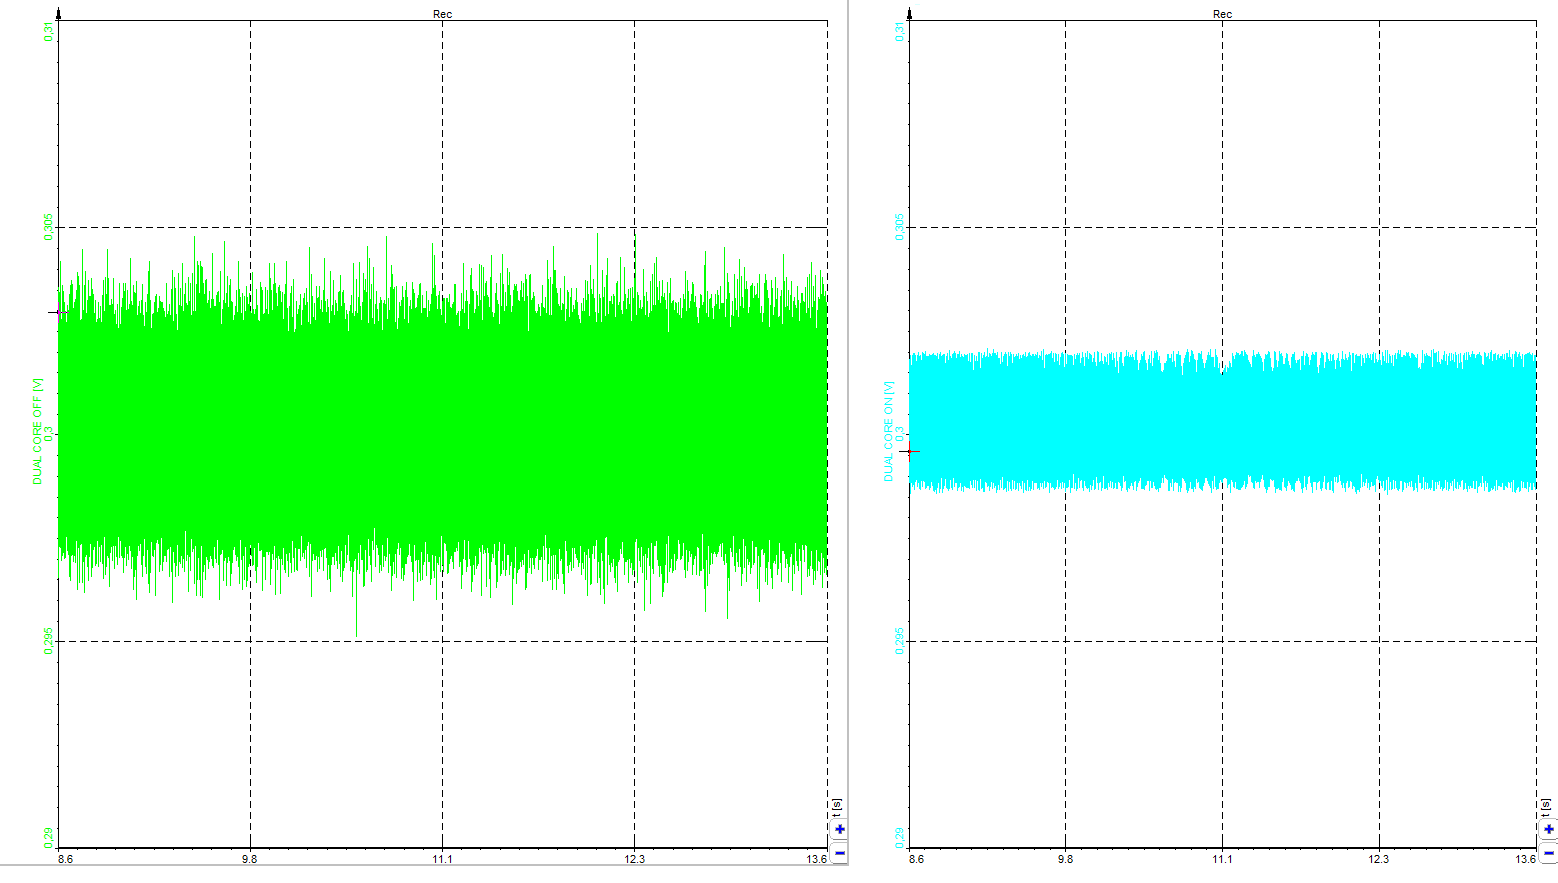
On the first channel, we will turn Dual core mode off, on the second Dual core mode will be turned on. This will render an image as seen below, where the difference in the noise levels can be seen. The graphs that are seen below are set to have the same scaling.
 Image 21: Difference in noise levels with dual core turned off and on
By the noise level, it's not hard to see where dual core mode is doing its job (right), and where it's turned off (left). With dual core mode turned on we get the same noise level in the 10 V measurement range as it would be if we were using 0.5 V range. This gives us a better look at lower signals.

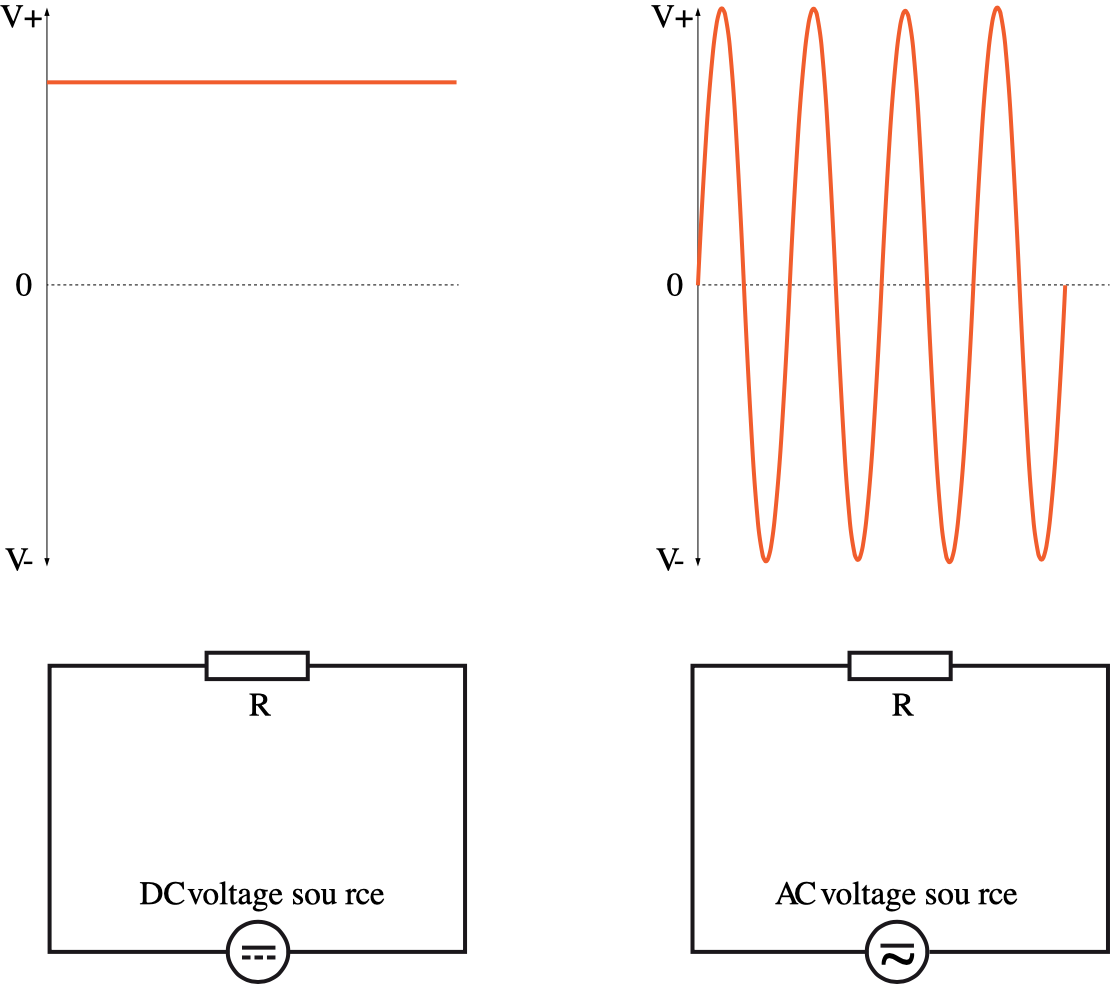 DC circuits (left) versus AC circuits (right)


