Analysing Data Files and Data Post-Processing

Once data has been acquired, there are a number of things that you can do with it: review data, display data in selected instrument display with a signal overview, replay data, ... Post processing is a great feature which allows adding new math channels in analyse mode or modify existing math channels.

The Analysis mode is an important part of Dewesoft X for analyzing and recalculating acquired data. Once data have been acquired, there are a number of things that you can do with it:

  • review data,
  • display data in selected instrument
  • display data with signal overview,
  • replay data,
  • start/stop replay and sound output,
  • arranging instruments,
  • assigning channels,
  • watch events,
  • signal analysis,
  • reload triggered file,
  • printout of instruments,
  • store settings,
  • copy elements to clipboard,
  • exporting data,...

To enable efficient analyzing process for acquired measured data you must leave the Dewesoft X Measure mode and enter the Analysis mode to perform the following procedures:

Image 1: Analysis mode 

Data file actionDescription
Reviewing load acquired data stored in a file, display the file information and data in selected instrument display, replay data and select data to analyze
Post-processingdefine and recalculate additional math channels
Publishingprint the displays, instruments and copy channel informations to clipboard
Exportingexport data for off-line analysis using other software with possibilities to export several data files at once

Reviewing data files is very helpful to analyze measured data and includes the following procedures:

Data file ActionDescription
Load data file
Load acquired measured data stored in datafile, display data file information, ...
Display dataDisplay data in selected instrument display with signal overview, selecting a channel for overview window, ... 
Include video fileVideo data can be included and synchronized in Dewesoft X, zoomed, scrolled, scaled, played, resynchronized, removed from the data file, ...
Replay dataStart/stop, sound output selection, replay mode, replay direction, and replay speeding on different display screens.
Select dataAnalyze acquired measured and video data with functions to have a more detailed look at the recorded data with selection range of stored data.
To help measure a precise value over a long time.
Selecting triggered data (to reload multiple trigger events within one file).
Store settings and events.
Work with eventsAdd, display, and save keyboard, notice, and voice events.


When starting Dewesoft X and entering the Analyse mode, it will present you with a selection window where you can select any data file to load. The window offers subfolders of our main data folder, a lot of information in the file list about the existing files, and the currently selected file.

If you have just captured some data and you press the Analysis button, Dewesoft X will automatically load the recent data file.


Image 2: Analyse mode 


Folder structure

The upper left section shows the folders structure. In this area, we can select where the data file should be loaded from. If we have subfolders, we can choose them by double-clicking on the subfolder.

The first level data folder can be changed on either clicking on the 'up' button, which brings us one level higher in the folder structure or by clicking the button to browse for the new folder. The default folder can be remembered by right-clicking on the folder list and selecting 'Set by default' choice.


Image 3: Set default project 


List of Data Files

In the upper right section, you can select the file which should be loaded for analysis with double click on it. It provides you also with plenty of information about all files available in the selected folder:

PropertyDescription
NameName of the file.
SizeSize of the file in kB or in MB (1 kB = 1024 Bytes).
Start store timeDate and time when the file has been modified.
VersionThe version of Dewesoft X used to acquire the data file.
Sample rateThe used sampling rate; it will also show the reduced rate if the data was stored slow and fast on the trigger.
ChannelsNumber of active channels.
Store modeOne of the four storage modes: 'always fast', 'always reduced', 'fast on trigger or always reduced', and 'fast on trigger'.
VideoVideo type and file size (available only when a video has been recorded).

'Settings' tab Informations

The bottom of the window displays the Settings, Events and Data header, File locking, and Preview of the selected file. As a standard, Settings is selected.


Image 4: Settings tab


This part shows now information about the selected file on General file information section (Sample rate, Store date and time, Number of channels and Trigger condition) and more detailed information on Channel info section:

InformationDescription
Ch. No.Channel number.
IDID number of a channel.
NameChannel name and color of the channel.
AmplifierSettings Type, input range, and filter range of the amplifier. For new amplifiers also the serial number is mentioned.
SensorSensor used.
RateThe rate will show the acquisition rate of each channel. This is important if the sample rate divider is used or if the channel is asynchronous (CAN, GPS, PAD,...). In this case, it will show an approximate sample rate (or keyword ASYNC with old file versions).
DescriptionChannel description
UnitChannel unit.
ScaleScaling factor k ( \( y=kx +n \) ) 
Amplifier info
OffsetScaling offset n ( \( y=kx +n \) )
MinMinimum value within the whole file for the channel
Sensor unbalance
MaxMaximum value within the whole file for the channel

If you want to select which columns you want to display, right-click in the columns and select the Edit columns option.


Image 5: Edit columns 


'Events' tab Informations

When you change to Events, all happened events will be displayed. Events are:

  • start and stop of measurements,
  • keyboard events,
  • notice events, and
  • voice events.


Image 6: Events tab informations 


'Data header' tab Informations

The Data header finally displays all the information you have entered in the data header window at the beginning (or the end) of a measurement. The exact content depends also on the fields you may have changed in the global header design.


Image 7: Data header info


Loading a Data File

To load any existing data file, you can double click on the data file or select the Load data file from the main Dewesoft X data menu (in Analyse mode).


Image 8: Load the data file


As soon as you have reloaded the measurement file in Dewesoft X Analysis mode, the recorded data will be displayed. Independent from the selected instrument type, there are several elements which are the same for all instruments.

Signal overview window - on the top of a display screen is a small bar with one channel as an overview of the whole measurement with the possibility of selecting a channel for overview and displaying the signal only within the selected time overview box using a time selector.

Image 9: Signal overview window


All of the channel scaling, name, and unit info that was in effect at the time of recording is restored so that your data can be properly interpreted.

The display settings can be done in Measure and Analysis mode. You can use in Analysis mode all of the features available in the Measure mode: to add/delete graphs and inputs from each graph, change the X-axis and Y-axis scales, and more. If we alter the display settings in the Analysis mode we need to manually store those settings with choosing Data Store settings and events and we can also use these settings for next measurement with Data Use setup for the measure.

The interesting area for us is now the top area of the screen. You will see several elements that are not available in the Measure mode.

Signal Overview window

Each instrument offers at the top of the screen a small bar with one channel as an overview of the whole measurement:

Image 10: Overview window


Stored data file offers at the top of the screen a small bar - signal overview window:

  • symbolic display of signals in white-bordered rectangular with yellow cursor as an overview of the whole stored data
  • start date and time of stored data
  • end date and time of stored data
  • time selector

Within the time overview bar, there is also a cursor available and as a standard, it is located at the left side of white-bordered rectangular. If you look carefully at this area, you will see a yellow vertical line and this is a cursor.

Select a channel for the Overview window

Click on the overview bar to select it. Now you can change the displayed channel - as a standard, it is the first acquired channel. To do that simply click on the name of the channel in the channel selector. Now in the overview window, a symbolic display of the newly selected channel is displayed:

Select the channelImage 11: Select the channel


Whatever is displayed in the instruments below, the time overview bar will always show you the whole signal. For example, you have selected just a small-time area in the recorder within the whole signal; you get this area marked in the overview bar as it is shown on image 11 - white square.

Time selector

When you click on the Time selector icon on the right side of the overview bar, the following window will pop-up on the analysis screen.

Image 12: Time selector


  • Shown time - from a drop-down list in right field hours, minutes or seconds time unit can be selected
  • Start time - exact position within the file; in left field, the date is displayed, which can be selected from the drop-down list (the calendar is displayed); in right field start time to show measurement is displayed in form h:min:sec - we can directly enter values or select group h, min or sec and after that set values with up and down button.

The result depends on the used screen instrument: the single value elements like digital or analog meter, bar graph,... will show the current values the beginning of the selected time window, multiple value elements like the recorder, scope, FFT,... will display the signal only within the selected Time overview box (= like a zoom function).

Time overview box

The selected range of stored data within the whole signal is marked in the time overview bar with a white-bordered box. The symbolic display of signals outside of this box is dimmed.

Image 13: Selected range of stored data as a result of zooming in on the recorder display 


Within the time overview box, there is also a cursor available and as a standard, it is located at the left side of the box. With mouse pointed on yellow cursor mouse cursor changes to and then you can drag this cursor within the box. At the same time, also the yellow cursor moves relatively proportional to stored data in the instrument display on the central part of the screen.    

If your data were stored on the trigger, press the trigger button 
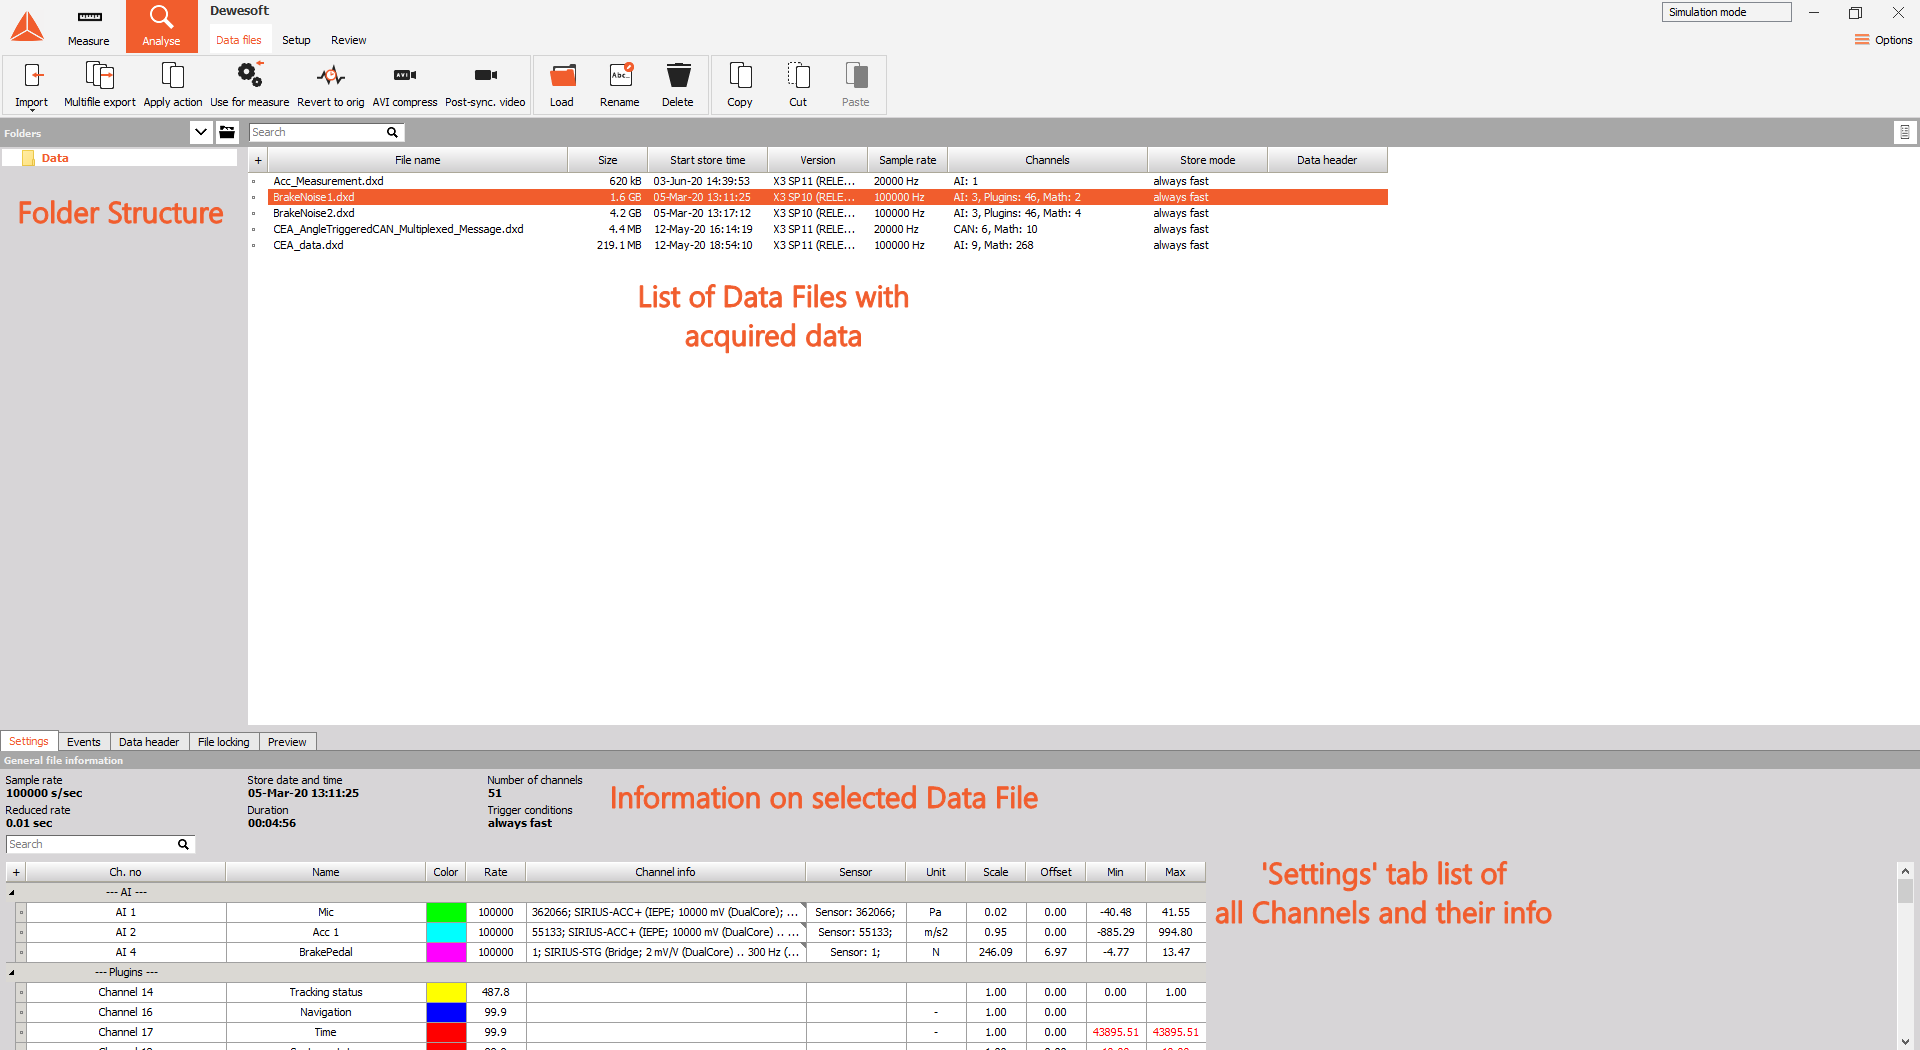
to zoom in the whole area between the triggers. Use the left and right button to move between the triggered areas.

In addition to the online visualization, the Dewesoft X Analysis mode offers several functions to have a more detailed look at the recorded data:

  • Selection range of stored data- we have options to narrow range of displayed data and select only part - a smaller range of stored data:
    • Measurement cursor
    • Zoom in time axis
    • Window zoom
  • Lock cursor 1 to select position - to help measure a precise value over a long time

Measurement Cursors for selecting the data Range

Measurement cursors can be used for selecting the data rangeImage 14: Measurement cursors can be used for selecting the data range

The recorder and vertical recorder offer two measurement cursors for the active graph on top labeled with for Start show time and for End show time. You can drag these cursors to select a certain region in two ways:

  • move mouse cursor to the first position of interest; click (measurement cursor appear on this position) and hold left mouse button and move (on mouse cursor appear measurement cursor and move whit him) to the second position of interest
    Image 15: Move the mouse cursor to the 1st position of interest


  • drag the first cursor from the leftmost side of the graph to the position of interest and the second cursor from the rightmost side of the graph (when mouse point on the vertical line of measurement cursor mouse cursor change to a two-sided arrow which indicate feasibility to move measurement cursor)
    Image 16: Drag the first cursor to the position of interest  

No matter in which recorder you use the cursor, it will automatically move in all displayed recorders and vertical recorders simultaneously.

On the left part of the display, the readout values of the currently selected graph at cursor position will be displayed. To show values from another graph, simply click on it and the values will change. As there is only a one-time base available, the cursor position is the same for all the displayed graphs:

Image 17: Enable the Cursor table Values option 


As we can see above, in Analyse mode on the left part of the screen below recorder settings appears new section to display readout values of signals and time at cursor position - Time and values cursor with icon to lock cursor.

Image 18: Lock the cursor position 

Zoom in time axis

After loading the data, you will always see the signal over the complete storage time. But you can also see details - zoom into the area with:

  • Just use both measurement cursors as described above to select an area of interest. Move the mouse between these two measurement cursors - it will change the appearance immediately to the zoom icon. Then simply do a left mouse click to zoom into the selected area. We can do this several times to come to the region of interest. We can also drag the x scale left and right to position the data exactly. To undo the zoom just use the right mouse button and you will zoom out step by step to the full scale.
  • Do a left mouse click on the button on the right side of the graph to zoom into the selected area. To undo the zoom use button (below +) and you will zoom out step by step. As there is only one-time base available all graph is zoomed in (or out) together, independent which button is selected. You can do that action several times to zoom into the selected area step by step (by each step is a decrease of range about 1/25 prior range) and is meaningless in what place cursor there is. By first zoom out graph return to previous zoom (range) and after that step by step. If we use before multiple zoom (with +button or measurement cursor), in the first step displayed range to return to about 3/4 its whole range and after that step by step.

After zoom into the selected area, you will see now more details.

The signal overview bar at the top of the recorder display shows always the current position within the signal. You can also click on the marked area and move the marker - this will also move the displayed signal. You can do that action several times to see the information of real interest.

Lock the 1st Cursor to the selected position

We can position the measurement cursors anywhere within the acquired signal. But what to do if you have to measure a precise value over a long time? The resolution may not be enough to set the measurement cursors at the exact positions.

The solution is quite simple: Zoom into your signal at the point where you want to place the first cursor and position cursor 1 there. Now press the icon to fix cursor 1 to its current position. Lock cursor icon change to and the cursor will now change to green color and the number at its top changes to locked .

Now you can zoom out and in again to the desired second position. During that, you will see a new cursor 1, but this one is only used for zoom issues - not for measurement. The 'original' cursor 1 is still locked at its position. Use cursor 1 and 2 as described before to define the second area of interest. Now move the cursor 2 to the point of interest and you can read out the desired value from the time and cursor values readout section.

To unlock the 1st cursor position, simply press the icon again, so the cursor  disappears, and the cursor 1 is again available for new locks.The same can be done with 2nd cursor.

If your data consists of events that can be captured, we can choose to store fast on trigger. To read more about triggered storing visit the Storing Options PRO training course.

The trigger event can be defined in the software and then Dewesoft X will wait for this event and:

  • store only the portion of interest by choosing "fast on trigger" storing option
  • acquire data with two speeds (to have reduced data also for the regions without trigger event) - we need to use a different strategy "fast on trigger, slow otherwise".

'Fast on trigger' triggered data file

The reload of multiple trigger events within one file shows a different display. We can see that only the trigger events are stored and for the rest of the time the data is blank.

Image 19: Triggered data file 


Note that there is a new 'trigger mode' button in the data preview. This gives us a chance to review the trigger events without zooming in the data. If we press it, the first trigger event is automatically zoomed in. The trigger mode button changes to the arrows button where we can browse between the events. If we press those two buttons, the recorder shows the trigger events one by one. On the data preview, we see the currently selected trigger event. On the first trigger, the only arrow is available - to navigate forward to the second trigger and on last trigger, only arrow  is available - to navigate backward.

Image 20: Move through the triggered data with arrows


For leaving the trigger mode we can right-click on the recorder to zoom out to the full region.

'Fast on trigger, slow otherwise' triggered data file

If we acquire similar data with this strategy and reload it, we can see from the picture below that we have reduced data also for the regions without trigger events.

Image 21: Fast on trigger, slow otherwise data file 


If we zoom in the data, we can see reduced stored data before the trigger, where we can only see the maximum and minimum of the signals, and then for a region with a trigger, we can see the full speed data.

Image 22: Full speed data can be seen on a region with a trigger, and reduced stored data on the area before the trigger 


In any instrument, it is possible to replay the data in real-time, faster or slower.

Therefore Dewesoft X offers special control buttons:

  • Start/Stop,
  • sound output selection,
  • replay mode for selection different ways of replay,
  • replay direction and replay speed.


Image 23: Replay Action Buttons 


With these four buttons you can control the replay process:

  • start / stop the replay,
  • define a channel for a sound output,
  • change the replay mode, and
  • change the replay speed and replay direction.

Start/Stop replay

To start the replay simply press the play button .  Dewesoft X will immediately start to move through the acquired data: the FFT is calculated, the scope shows the current data, the video file is replayed, digital or analog meters, bar graphs,... will change their value continuously and in recorders or scopes you will see the yellow cursor moving to indicate the current position within the file.

When started the replay, the Play button change to stop button, to stop the replay simply press the Stopbutton. After pressing the Stop button don't forget to select None at the loudspeaker icon to switch off audio replay.

Sound output

We can even hear the sounds we have stored. Next by the Play button, there is a loudspeaker button, but with the red cross. If we click on it, the channel list will appear to select analog input channels for output to sound card. Choose the only channel we have stored and the loudspeaker will not have a red cross anymore. Now press again a Play button and whatever we have recorded will be heard from the loudspeakers.


Image 24: Click on sound and select the Sound Output channel 


After pressing the Stop button to stop the replay select None at the loudspeaker icon to switch off audio replay.

Replay mode

You can select between three different replay modes (simply click on the third button from left to change it):

ImageModeDescription
Normal mode
Replays data once from the beginning to the end of the file or the selected time window. 
Loop mode
Replays data continuously from the beginning to the end of the file or the selected time window.
Scroll mode
Replays data once from the beginning of the selected time window to the end, then it continues to replay by moving the selected window until the end of the file is reached.

The replay mode can be changed also during a running replay process.

Replay speed

Use the button to change the replay speed either on faster or slower.

You can slow down the replay mode to:
1/2x, 1/4x, 1/8x, 1/20x, 1/50x, 1/100x, 1/200x, 1/500x, 1/1000x or 1/2000x real-time,  

or you can speed up the replay mode to:
1x, 2x, 4x, 8x, 10x, 100x, 1000x, 2000x or 5000x real-time.

The replay speed can be changed also during a running replay process.

You can also see all your events - keyboard, notice, and voice types - on the event list at the top right, directly below the replay control buttons.


Image 25: All of the events are saved in the message window 


Select any event either by clicking on its white or gray vertical line on any recorder graph, or by scrolling through the EVENT selector at the top right of the screen. This is a scrolling list that shows:

  • when data recording began - indicated by a vertical red line on the graph with a (beginning) at the top, and each type of event, listed in chronological order, and marked with the exact time that they occurred,
  • the end of the recording is also marked with a vertical red line and an (end) at the top,
  • if you click on a voice event, it will replay using the speakers in your computer (assuming that you have this DirectX sound recording / replay capability),
  • if you click on any notice event, it will show in the EVENT section, and just by hovering the mouse over the gray vertical line, the text that you typed in at the time of recording.
  • Keyboard events show the exact time that they occurred.

Manage Events

As mentioned before, all events are displayed in the recorder. To add an event just clicks on notice icon or press the shortcut key, for example < n > for a notice event and the enter event window will pop up. Time of event fields are already filled, enter Event text and with press Add button accept the new event.

To change previous entered notice right click on this notice in the list, from the displayed menu choose Edit and Enter event window will pop up. In Edit window Add change to Update button, with which we accept changes to carry out in the Event text field. To delete notice select Remove from displayed menu.


Image 26: You can either Edit or Remove the event 


Enter as many events as you need; the types Keyboard event, Notice event, and Voice event can be mixed. See on image 25.

When you select the Events tab, you see the entries for all old and new events:


Image 27: Event preview inside the Events tab 

Event Types

With different types of events, you can mark your data files. Conventional chart recorders have event markers, which are used to mark areas of interest in the data for later review. Dewesoft X builds on these capabilities by providing three ways of marking your data:

  • Keyboard Events - just press the spacebar or the icon to mark an area of interest. A thin gray vertical line will appear on the data at the location, marked with a symbol, and a notice is added to the scrolling EVENT box.
    Image 28: Keyboard Event marker 
  • Notice Events - press < n > key on your keyboard or the icon and then type some text in. The text input dialog box will appear:


    Image 29: Enter event text 

    When you confirm with the Add button, the text is added to the record at that point. You can also click the OK icon on the screen to enter a notice event. The event is marked with a thin green vertical line with letter 'N' and an icon on data at the location when we started entering the event.

    Image 30: Notice Event marker
     
  • Voice Events If you have a DirectX sound card installed, you can use a microphone to make spoken notices to your recorded data. Simply press and hold down the < v > key on your keyboard, or click the microphone icon and then speak into the microphone. Release the key when done. These voice events can be replayed through your speakers later on, and are a great way to add a rich layer of information to your data. This event is marked with the icon 'V' and a thin vertical blue line.


Events can be added, edited, or deleted also in Analysis mode.

Dewesoft X supports many different video cameras online. But there are cases (for example with very fast video cameras) where we have data file and the video file coming from the frame grabber. It is possible to synchronize those two files in Analysis mode with two simple steps:

  • Include Video file to copy video file and re-name it according File name conventions

  • Video synchronization to synchronize video file with analog data in the Dewesoft Xdata file with:
    • synchronization settings
    • resynchronize files
    • storing post synchronization information

AVI and DVI format is required for synchronization!

File name conventions

To include the high-speed video in Dewesoft X, there are only a few steps necessary:

  • After the acquisition of video file and the Dewesoft X measurement data, please copy *.avi high-speed camera file to the directory (via Windows Explorer) where the Dewesoft X data to be synchronized is located.
  • Please rename the video file to this specification: xxxxx.cam0.avi, where 'xxxxx' is the name of the Dewesoft Xfile to be synchronized. If we have more video files, we can name then xxxx.cam0.avi, xxxx.cam1.avi, xxxx.cam2.avi, and so on. 
    Image 31: Rename the video files to the xxx.cam0.avi format
     
  • Image 31 shows an example of how this looks like. Original Dewesoft X file is DF_AUTO_VTE_brake_test_thermo.dxd and therefore a video clip should be named DF_AUTO_VTE_brake_test_thermo.cam0.avi. After this open Dewesoft X, press the Analysis button to enter the Analyse mode and you should see already video file as part of the Dewesoft X data file.

Synchronization settings

After including video in the data file double click the file to open it. Dewesoft X will recognize that this file has no synchronization information included and will ask to synchronize it manually.

Video post synchronizationImage 32: Video post synchronization

The window displays the video file name and the number of stored frames (Frames found). Change the frame rate to the real capture rate of the camera (sometimes the .avi files hold correct values, but most of the time not). As an additional help, the Video size field shows you the video duration (length in seconds) at the currently selected frame rate. 

After that, specify the Pre trigger - how many pictures have been taken before the video trigger occurred (choose between frames, seconds, and milliseconds).

Trigger time finally defines the start position of the video: from trigger means the first appearance of a trigger event (or start of measurement - storing of analog data). In this case, both the measurement systems and video cameras require the same trigger source.

The second way is to define video start from relative time. In this case, the mentioned time counts from the beginning of measurement in seconds.

After you have done all settings press OK button - the files will now be synchronized, but the synchronization information is not stored at this time! Dewesoft X will now display both files in the Video display.

Resynchronize files

The video display can be handled as any other instrument within Dewesoft X: zoom, scroll and scale, play, ... - whatever is required. If the synchronization is not perfect, it can still be adjusted by selecting the tab Data files -> Post-sync. video.

Image 33: Post-sync video icon


NOTE: This option is only available if the synchronization information hasn't been stored.

Now you get the same Video post synchronization window as described in Synchronization settings. With an additional feature: Trigger time.

Image 34: Post-sync from trigger 

This is really a great feature, because you can zoom into your display, move the yellow cursor in the recorder to exactly defined position, and select Video post synchronization from the Data menu. If you do so, the video will be placed in the position of the yellow cursor. This will also work if a pretrigger is required.

Using this function, you can move position of the video file within the data file forward and backward as required.

Storing post synchronization information

Currently, there is no separate storage button available. To avoid doing all the synchronization setup every time, simply click on the Analysis button to go back to the file selection list. A warning message will now appear asking if the synchronization information should be stored now or not.

If you select Yes, the information is stored directly into the video file (not the data file) and is now available at any time, no further synchronization is required.

Warning: If you have stored post synchronization information once, it can't be changed anymore.

Therefore you should always keep a copy of the original video file, which doesn't contain this synchronization information.

Remove video from data files

To remove the assigned video from the data file, simply rename (or delete) the video file. In this case, the video file is not visible anymore in Dewesoft X. As the synchronization information is stored in the video file, there isn't even an error message, because the data file doesn't miss the video.

Make a short test: Rename the video back to the data file name and open it in Dewesoft X - the video is back and still synchronized.

A great feature of Dewesoft X is post-processing. It allows us to:

  • add new math channels in analyze mode,
  • modify existing math channels,
  • change scaling of online or offline channels.

So you could store only the raw data and then in analyze perform all needed mathematics. There are several ways to perform math analysis on already acquired data.

Let's start with a simple one. To add a simple math channel like filter we select the channel from channel selector, right-click and select Add math and then choose appropriate math.

Image 35: Add a simple math channel in channel selector


In this example, we have added the FIR filter. When the filter is set, data is automatically recalculated and put into the current display.

Next, we can edit the created or any other math channel (either added during measurement or offline) and modify or delete it by clicking on the math channel and choosing Edit math or Delete math (in this case Edit FIR filter or Delete FIR filter).

Image 36: Edit or delete math 


With click ok Edit, editing window of chosen math will pop up, allowing us to change calculation parameters. Upon closing the channels will be automatically recalculated.

Important: data file will be recalculated only on the chosen time interval. To reduce the time needed to recalculate huge data files, we can zoom in and define all needed calculations on small areas and then zoom out, press Recalculate and then Dewesoft X recalculates the whole file.

More advanced math can be defined in the math section by pressing the Offline math button or Setup button from the top menu.

Image 37: Offline math 


Now we prepare math channels like we would in Measure mode, by entering the Setup tab in Analyse mode and add advanced analysis like Power, Order tracking, Modal analysis, and all others.

Image 38: Add desired Math calculations in offline analysis mode 


When finished, go back to Review. Please note, that the Offline math icon changed to Recalculate.

Image 39: Recalculate button


Therefore select start and end for recalculation and press Recalculate. All added math channels will be calculated. When recalculated, the button changes again to Offline math, notifying that we can go back to math and modify the results to get the perfect results. We can change the color, scale, and offset of any channel.

NOTE: Lengthy calculations can be interrupted with the Escape key on the keyboard.

We can also choose that Dewesoft X automatically recalculates the data when zooming IN or OUT. This can be very useful when searching for an absolute minimum of maximum for the specific time slice.

We can save the results of post-processing by pressing the Save button. 

Warning: If the data is not calculated or not calculated for the full time of the file, only the setup of all math and display channels will be stored. If the offline math is recalculated for the entire time of the file, also the recalculated results will be stored in the data file.

When we have worked on math analysis for a single data file, this calculation can be applied to several data files. One chance is to press the round Dewesoft X button and choose the Load display and math setup and choose the appropriate setup or data file holding the right calculation. Selecting Recalculate and Save will finish the process.

Load display and offline math on a single data fileImage 40: Load display and offline math on a single data file 


Another option is to choose multiple files in the Analyse -> Data files and the choosing Apply action.

Apply action to multiple filesImage 41: Apply action to multiple files 

Select the original setup or data file with the defined offline math. Make sure that the channels in selected files are the same as in the original file. A progress bar will be shown and all the files will be recalculated.

 Select the original setup or data file with the defined offline mathImage 42: Select the original setup or data file with the defined offline math 

We have seen that it is possible to alter the data files as we like. Quite often it is required to keep the files intact and lock them for further processing. This can be achieved by locking the data file. Open the data file and choose File locking.

Image 43: Add File locking 

We can lock the files with password which must be entered the next time the file is opened, or we can lock the files permanently.

The file locking can be already done while measuring. For more informations visit the How to set up Dewesoft course - Security.

Dewesoft X analysis mode offers the following options to publish the data:

  • screen printout - printing measured data for the instrument on all available printers with the possibility to set:
    • page orientation
    • enter Header on measurement
    • multiple page printout
  • copy visual elements - copy to clipboard or copy widget data to another application

Screen Printout

In the Analyse mode, Dewesoft X offers a printing function. It is working with any instrument (Overview, Recorder, Scope, ...) and also with the setup. To do a printout, select the instrument, change the appearance as desired (see previewed page in the middle of the screen) and press the Print button.

Image 44: Print settings

Page Orientation

Select between Landscape and Portrait format.

Image 45: Page orientation 

Notes on measurement and page header

In the Header text, you can enter any comment. First, enable Show header and enter text.


Image 46: Enter header 


Beside the text header, the header also consists of a file name, page number, date and time of measurement, showtime.

Multipage printout

A multipage printout can be selected by checking the Multipage box. After that select time unit (sec, min, hrs) from the drop-down list and enter time resolution.


Image 47: Multipage printout settings 


Example: When the measurement duration is 1 min 35 sec and the time resolution of 40 sec is entered, multipage printout will print 3 pages -> first page for measurement time 0 - 40 sec, 2nd for 40 - 80 sec, and 3rd for 80 - 120 sec.

In the field bellow Time resolution value can be eventually set also Overlap time. The overlap time is the time that will be displayed twice in the printout - at the end of the first page and at the beginning of the next page.

Example: When for example above the Time scale=15 sec is entered, multipage printout with pages in all is defined first page for measurement time 0 - 40sec, 2nd for 25 - 65sec, 3rd for 50 - 90sec and 4th for 75 - 115sec.

We can display a preview of every page in multipage printout using the Next button for navigation up and the Previous button for navigation down between pages.

Printing

After all desired properties are set press the Print command button below print menu settings. This will open the standard Windows® Print window, where you may define your printer propertiesprint range, and copies as in other programs and start the printing job. 


Image 48: Set printing properties 


Dewesoft X uses the complete Windows® printer support. As a standard, Dewesoft X will suggest using your default printer, but you can select between all available printers - even network printer - and use also the printer spooler. 

After starting the printout, you can start to continue working with Dewesoft X , even if the printer is still running.

Copy Visual Elements

 For documentation in external applications, you can copy the display elements also into the clipboard.

Image 49: Copy to clipboard 


Select the desired instrument and select from the Edit menu:

Copy to Clipboard optionDescription
Widget as imageCopies only the selected widget
Widget group as imageCopies the whole group of selected widgets
Display as imageCopies the whole screen as an image
Widget dataCopies channels data from the selected widget
Widget group dataCopies channels data from the whole group of selected widget
Widget groupCopies widget with selected channels
DisplayCopies whole display with widgets and their data