The following section will go into more detail on the possible measurement setups that are available in Dewesoft X. We will show how to connect both voltage and current in various setups, along with explanations on setting up the measurements in the software. There are also a few screens that show what the possible measurements could look like when the setups are done and measurements are made.
DC power measurement
Hardware configuration
For a simple DC measurement please connect the voltage and the current to the Sirius as it is shown in the following image.
 Image 27: DC measurement hardware configuration
 Analog setup
In the next step the analog setup must be done in Dewesoft X for both the voltage and the current (Please refer to the pro training's on current on voltage as references). The image below shows what a typical DC set-up would look like.
Image 28: DC measurement analog setup Power module setup
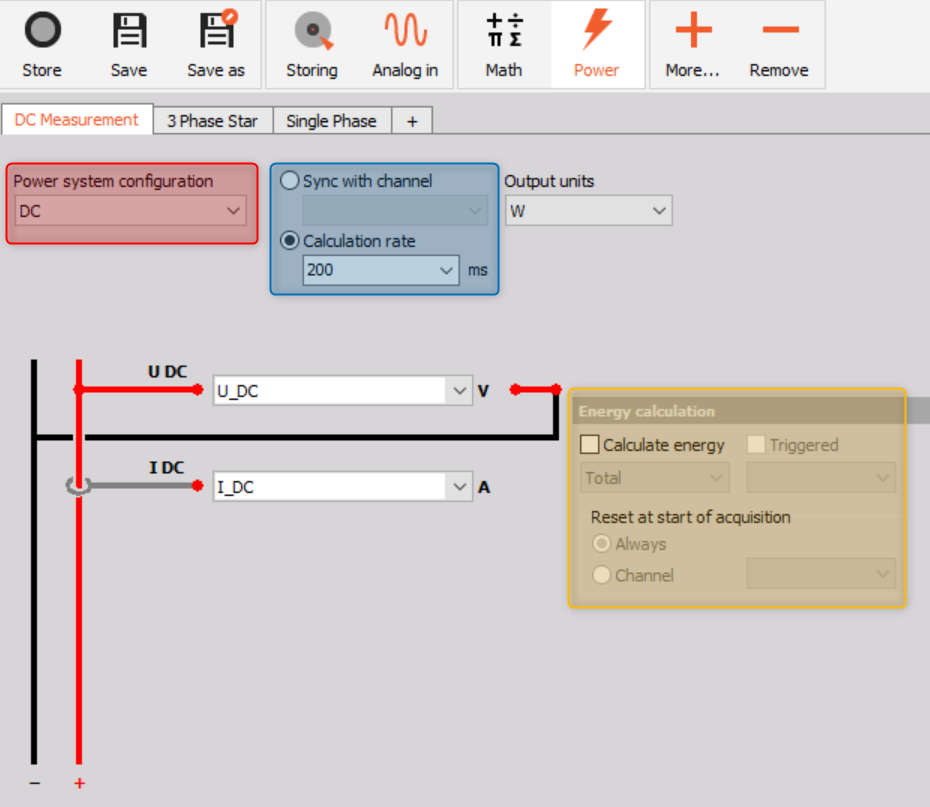
In the power module, the wiring must be set to DC measurement, this is illustrated in the image below in the red square. Then configuration for the selected application must be done.
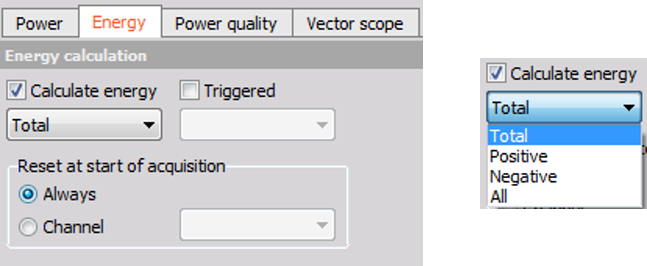
On the wiring schematic page, it is possible to select two different calculation modes, this is illustrated in the blue square in the image. Firstly, it is possible to select or type the required calculation rate, or the measurement can be synchronized to another channel. This synchronized channel can be from another power module e.g. a 3-phase power module. Additionally, an energy calculation can be added, as seen in the yellow square in the image.
Image 29: DC measurement power module setup DC Math power calculation (only required in Dewesoft X2)
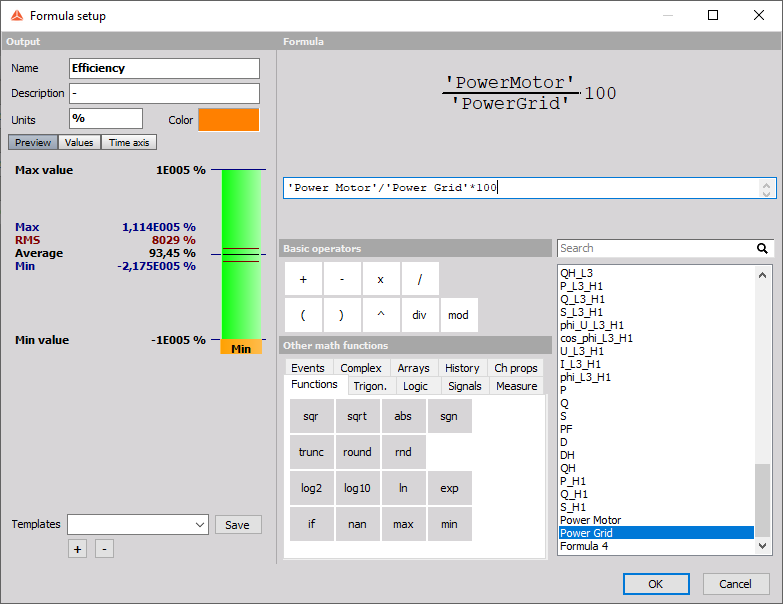
In Dewesoft X2, a simple math formula needs to be created, by multiplying the DC voltage with the DC current the DC power is calculated.
Image 30: DC math power calculation (only required in Dewesoft X2)
Measurement screen
Switching to the measurement screen the voltage, current and power can be visualized. In the image below, the battery power of an electric vehicle is shown. The voltage (magenta) is relatively constant while the current (green) is only present when power (acceleration - blue) is actuated.
Image 31: DC measurement recorder screen
1-Phase Measurement
Hardware configuration
For a single-phase AC measurement please connect the voltage and the current to the Sirius as it is shown in the following picture.
Image 32: 1-Phase measurement hardware configuration
Analog setup
In the next step the analog setup must be done in Dewesoft X for both the voltage and the current (Please refer to the pro training on current on voltage as references). The image below shows what a typical 1-Phase set-up would look like.
Image 33: Single phase measurement analog setup Power module setup
In the power module, the wiring must be set to single phase and the configurations for the specific application must be done.
For example, measuring a load connected to the public grid the line frequency will be set to 50 Hz (60 Hz in North America, parts of South America, Japan, etc.), the output unit should be Watt, the frequency source is voltage, number of cycles are 10 (12 in case of 60 Hz) and the nominal voltage (line to earth) is 230 Volts in Europe ( this varies from country to county). In the drop down list 120 V and 230 V can be selected, but in the input mask it is possible to enter the value that corresponds to the measurement.
Image 34: Single phase power module setup screen
Measurement screen
After switching to measurement mode, the screen design for the measurement can be set up to the requirements of the user. The image depicts a measurement screen with most common graphs and values that are measured in a 1-phase measurement.
Image 35: Single phase measurement screen2-Phase measurement
2-phase measurements are seldom, but some motors (e.g. step motors) for example are operated with two phases (one phase has a phase shift of 90° to the other).
Hardware setup
For a 2-phase AC measurement please connect the voltage and the current to the Sirius as it is shown in the following image.
Image 36: 2-Phase measurement hardware setup
Analog Setup
The next step would be setting the analog setup for the voltage and current input (please refer to the pro training on voltage and current for more information).
Image 37: 2-Phase measurement analog setupPower module setup
In the power module, the wiring must be set to 2-phase and the configurations for the specific application must be done.
Image 38: 2-Phase measurement power module setup screen Measurement screen
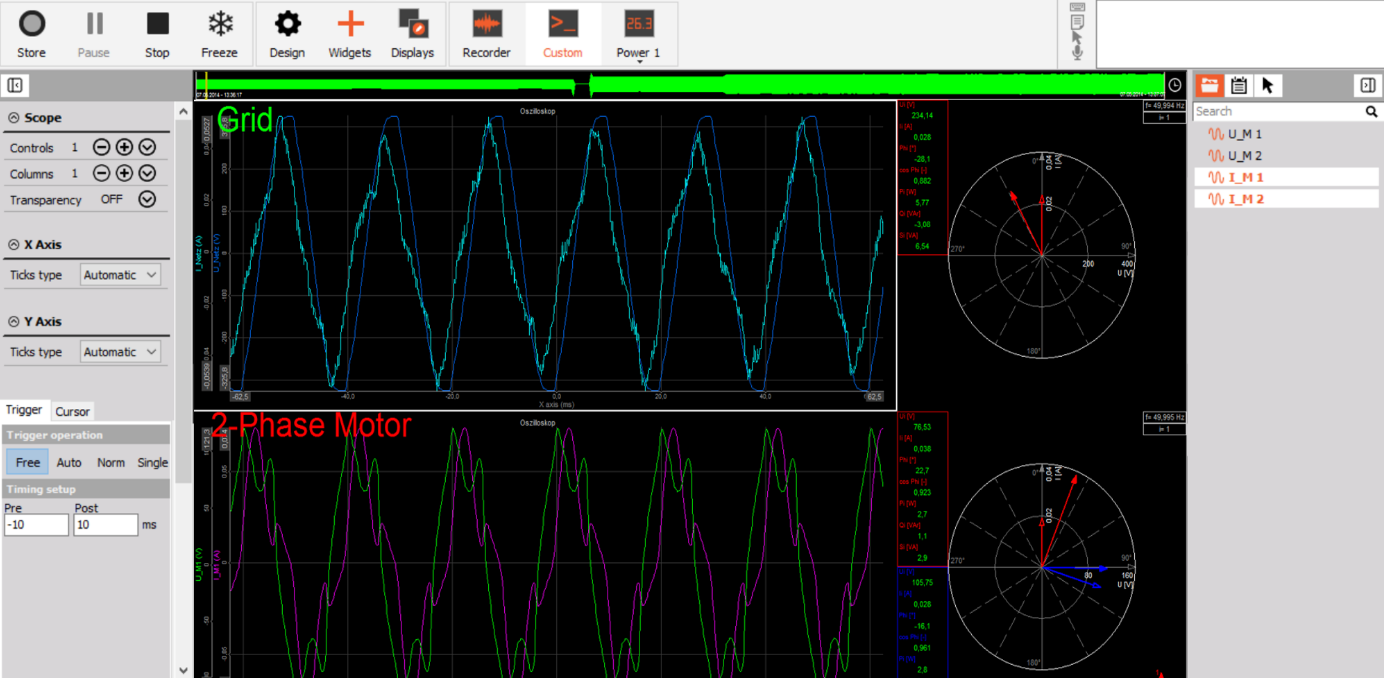
After switching to measurement mode, the screen design for the measurement can be set up to the requirements of the user. In this case, the scope and vector scope of a 2-phase step motor is shown as well as the single-phase voltage and current of the grid.
Image 39: 2-Phase measurement screen
3-Phase star measurement
The star connection is mainly used for measuring 3-phase systems, especially if a neutral line from the grid or the star point of a motor is available. The three phase voltages are connected to the Sirius HV modules on the high voltage side. The low voltage side of the three inputs is on the potential of the neutral line or motor start point. If both are not available an artificial star-point can be created by short-circuiting the low sides of the amplifiers.
Hardware configuration
The following image shows the connection for a 3-phase star measurement including three zero flux transducers for current measurement. In this measurement zero flux transducers are used therefore, a Sirius MCTS slice needs to be connected as well. This is because the zero flux transducers need more power than the Sirius 4xHv 4xLV can deliver. The Sirius MCTS is designed to deliver power up to 20W per channel.
Image 40: 3-Phase star measurement hardware setup
Analog setup
The next step would be setting the analog setup for the voltage and current input (please refer to the pro training on voltage and current for more information).
Image 41: 3-Phase star measurement analog setup Power module setup
In the power module, the wiring must be set to 3-phase star and the configuration for the specific application must be done.
Image 42: 3-Phase star power module setup
Measurement screen
After switching to measurement mode, the screen design for the measurement can be set up to the requirements of the user. In this example the load of a household is shown.
On the top left of the screen there are digital meters that display the voltage and current values in RMS, in the middle is the current power that is being consumed from the grid and on the top right-hand side current power values of the three phases are shown. The left scope in the middle of the screen shows the waveform of the voltage, and the right one the waveform of the current (which is quite distorted). At the bottom of the screen the load profile is shown in a recorder.
Image 43: 3-Phase star measurement screen3-Phase delta measurement
The delta connection is used in the absence of a neutral line or star point on a motor. The three phase voltages are connected to the Sirius HV modules on the high voltage side to the live terminals (Red). The neutral terminals of the HV amplifier must be connected to the next live terminal (neutral terminal L1 to live terminal L2, neutral terminal L2 to live terminal L3 and then the neutral terminal L3 to the live terminal L1).
Hardware configuration
The following image shows the connection for a 3-phase Delta measurement including three zero flux transducers for current measurement. In this measurement zero flux transducers are used therefore, a Sirius MCTS slice needs to be connected as well. This is because the zero flux transducers need more power than the Sirius 4xHV 4xLV can deliver. The Sirius MCTS is designed to deliver power up to 20W per channel.
Image 44: 3-Phase delta measurement hardware setup Analog setup
The next step would be setting the analog setup for the voltage and current input (please refer to the pro training on voltage and current for more information).
Image 45: 3-Phase delta measurement analog setup Power module setup
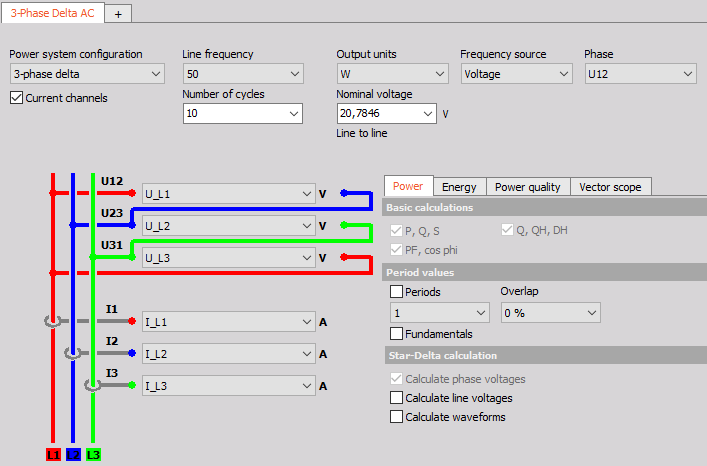
In the power module, the wiring must be set to 3 phase-delta and the configuration for the specific application must be done.
Image 46: 3-Phase delta power module setup
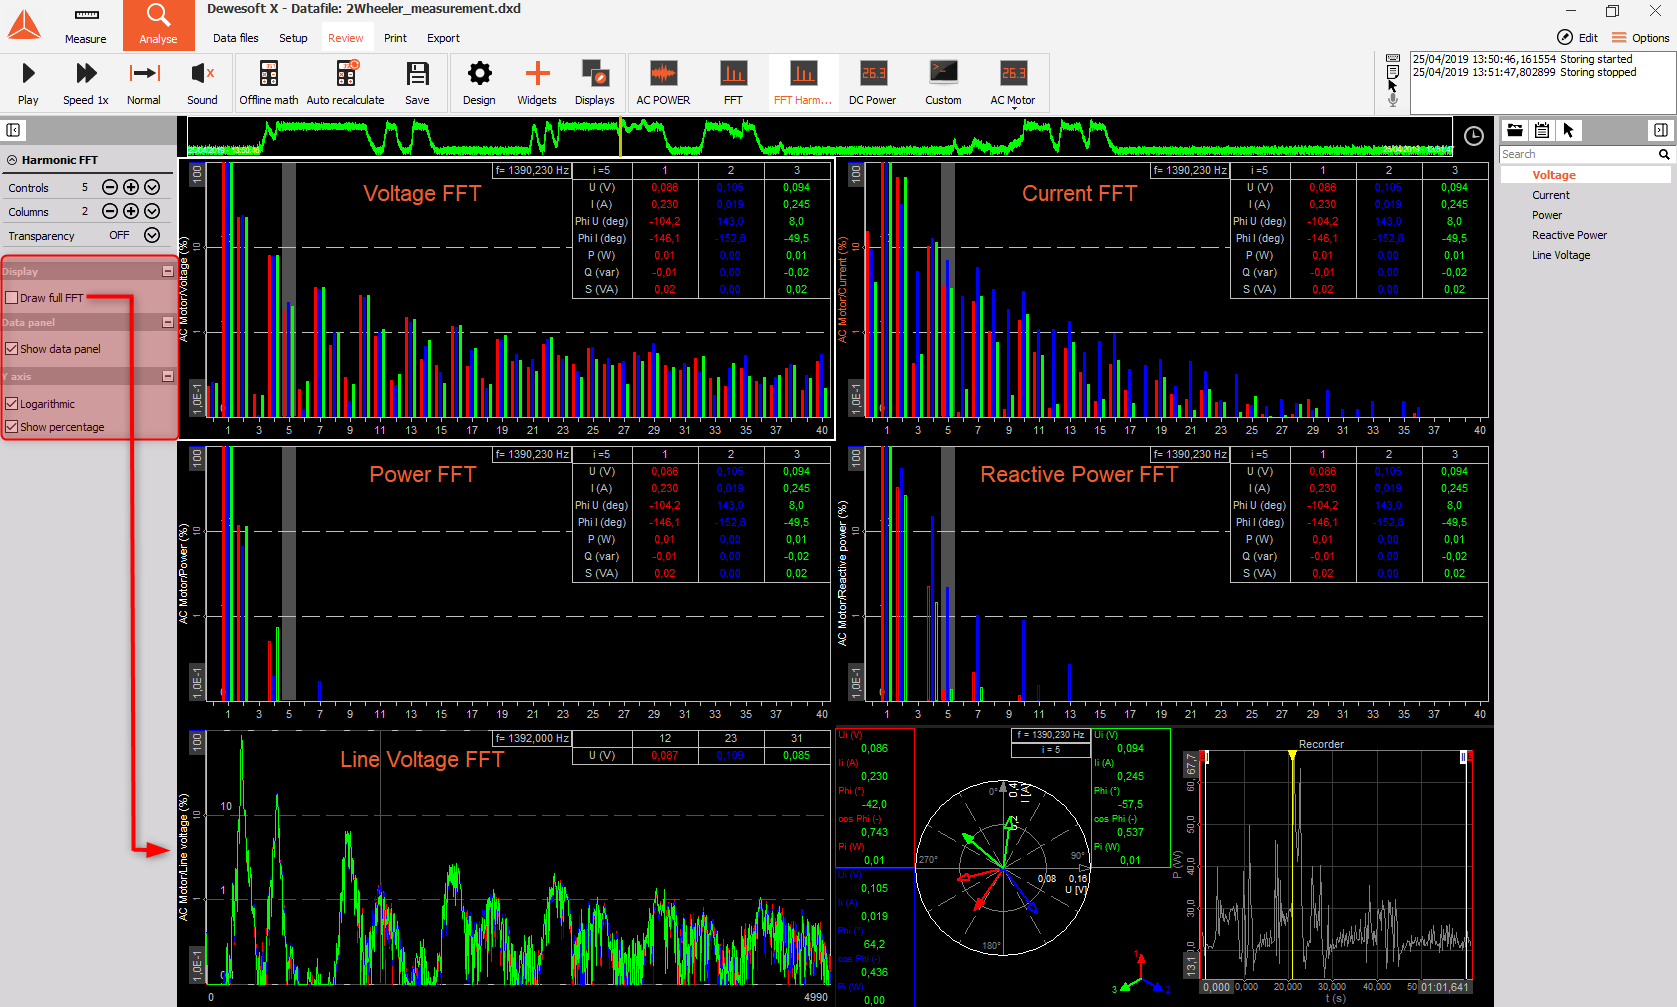
Measurement screen
After switching to measurement mode, the screen design for the measurement can be set-up to the requirements of the user. In this example the measurement of a PV inverter in delta configuration is shown. The vectorscope on the top right shows that the power is being fed into the grid, therefore the current vectors have a phase shift of 180° to the voltage vectors compared to where they would be if the system was consuming power. Further illustrated are the waveforms of both voltage and current on the scopes as perfect sinusoidal waveforms.
Image 47: 3-Phase delta measurement screenAs a comparison in the next image a 1-phase PV inverter is depicted, with unfavorable wave-forms for both voltage and current. The voltage has a rectangular waveform, electrical devices like this one puts large amounts of stress on the grid. This is mainly due to harmonics that are present in the signals, they cause distortion in voltage and current waveforms causing them to take on different waveforms compared to the ideal Please refer to the Power Quality pro training for more information.
Image 48: 1-Phase PV inverter measurement screenStar - Delta calculation
A special feature in the Dewesoft X power module is the star-delta calculation.
Image 49: Star-Delta calculationThis feature allows for the calculation of all values of a delta connection out of a star connection (waveform, RMS values) and vice versa. This means that no matter the hardware connection to the system, both connection types can be measured. For example, to see the analog voltage signal of a delta connection when a star connection is being used, just select the option "Calculate waveforms" highlighted in BLUE in the figure. The next option highlighted in RED "Calculate line voltages" allows RMS voltages and harmonics to be displayed.
Image 50: Calculate line voltages and calculate waveforms The following table shows the calculations that are used in Dewesoft X to do the star-delta and the delta-star conversions.
Image 51: Star-Delta and Delta-Star conversion calculations in the power modules
Aron, V-connection and 3-phase 2-meters
With some applications, only two currents and / or voltages are measured instead of three in a three-phase arrangement. The main reason for this type of measurement is to save costs.
This is done for measurements where it is completely sure that the load is absolutely synchronous, the third current can then be calculated from the two currents that were measured. This is often done with grid measurements (expensive current transducers, symmetrical load).
Aron connection
Hardware configuration
The most common way of measuring active power with symmetrical and asymmetrical loads without an N connection is the two-power meter circuit or Aron circuit. It has the advantage over the three-power meter circuit that it saves one measuring device and that cos phi and reactive power determination is also possible with a symmetrical load. The Aron connection is a star connection where only two currents are measured.
Image 52: Aron connection hardware setup Power module setup
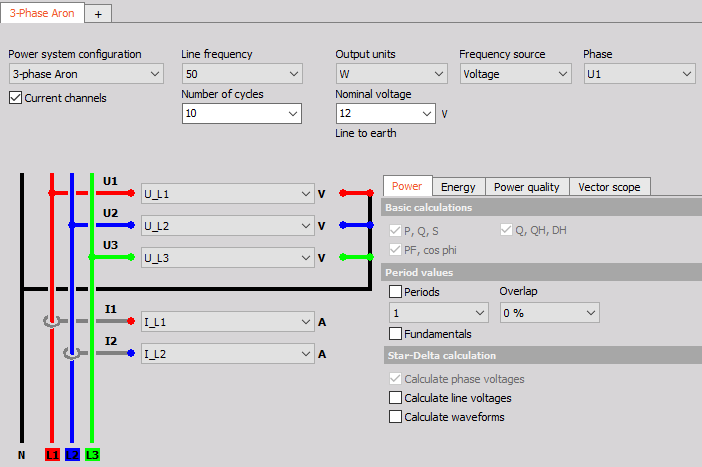
In the power module, the wiring must be set to 3-phase Aron and the configurations for the specific application must be done.
Image 53: Aron connection power module setupV-connection
Hardware configuration
The V-connection is a delta connection where only two currents are measured, but fundamentally works with the same principle as the Aron connection.
Image 54: V-connection hardware setup Power Module setup
In the power module, the wiring must be set to 3-phase V and the configurations for the specific application must be done.
Image 55: V-connection power module setup 3-Phase 2-meters connection
Hardware configuration
The 3-phase 2-meters Connection is a delta connection where just two voltages and two currents are measured.
Image 56: 3-Phase 2-meters hardware setup Power module setup
In the power module, the wiring must be set to 3-phase 2-meters and the configurations for the specific application must be done.
Image 57: 3-Phase 2-meters power module setup
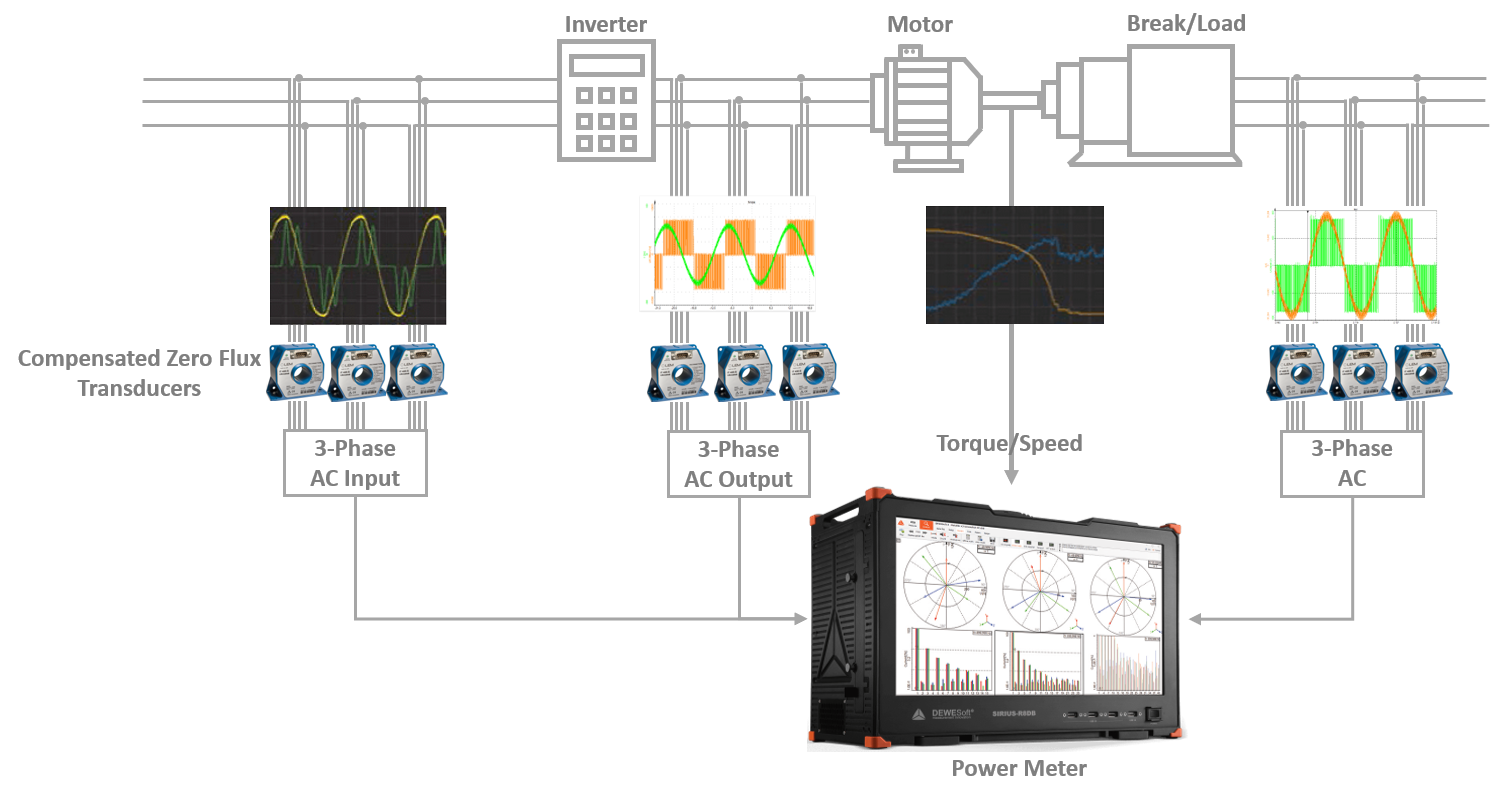
 Image 1: Power analysis module can be used for various applications